Budget Latency, Capacity, and Cost
Turn user time, tail latency, concurrency, capacity, retries, cache semantics, quality, and total cost into a segment-preserving product envelope.
Resource behavior is product behavior
Patchwork’s performance dashboard reports an average response time of 673 milliseconds. The team celebrates. Most text queries feel quick.
Image-heavy requests on mobile networks tell another story. Their slowest cases exceed 1.3 seconds before rendering begins. Two of those cases also lose evidence because a fast fallback skips an expensive compatibility check. The average hides both the waiting and the quality loss.
Latency, capacity, and cost are not infrastructure details that begin after model selection. They shape which behavior reaches users, which segments are served, which controls survive load, and which failures amplify. A system that is accurate only when traffic is low or when evidence is cached is not accurately described by its offline score.
This chapter advances PF-09 to v0.2 with a synthetic end-to-end resource envelope. It preserves component budgets, request distributions, text and image cohorts, cold and warm states, concurrency, synthetic cost units, quality gates, and three explicit configurations. It selects one bounded Pareto choice rather than claiming a universal optimum.
No provider prices appear. Prices, quotas, and named-model throughput are volatile adapters. The durable method is to connect resource measurements to the behavior contract, evidence, permission, freshness, segments, and consequences.
Start with the user’s clock
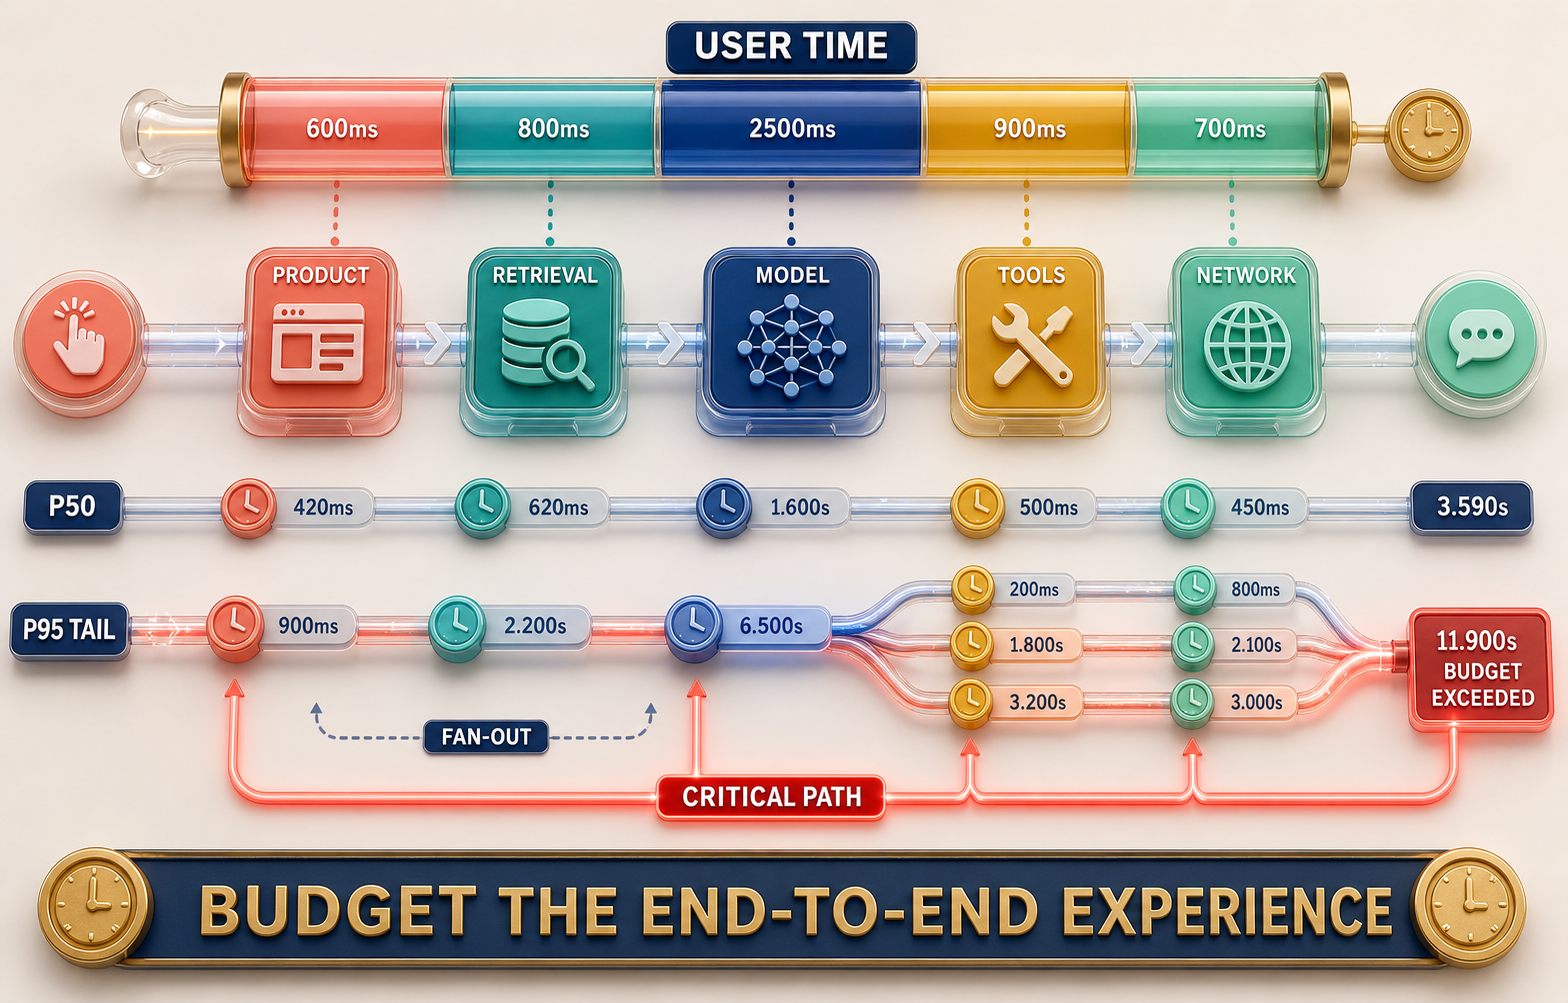
The user experiences one elapsed path, not a collection of component dashboards. Begin when the product accepts intent and end when the result becomes usable or a truthful terminal state is visible.
Patchwork’s path can include:
- image decode and normalization;
- request validation and authorization;
- feature or embedding lookup;
- candidate retrieval;
- permission and freshness filtering;
- ranking and compatibility checks;
- optional explanation generation;
- output validation;
- interface and network delivery;
- fallback or reconciliation work.
Some steps are serial. Some run concurrently. Some occur only on cold, failure, or effect paths. Adding median values from a dashboard can therefore misrepresent the actual critical path.
Define the path as a graph. For every node, record start condition, deadline, downstream dependency, concurrency, resource units, cache state, failure behavior, and whether the user waits for it. For every edge, record serialization, fan-out, cancellation, and state transfer.
The end-to-end budget is a design constraint, not a promise invented from preference. It must reflect the task and consequence. A user browsing inspiration can tolerate different delay and degradation from a user confirming a compatibility-sensitive purchase. One global target can hide this distinction.
Distributions replace the comforting average
An average answers a limited question: total observed latency divided by request count. It does not reveal how many users waited much longer, which segments suffered, or whether a few extreme cases consumed capacity.
Report at least:
- count and time window;
- minimum and maximum when diagnostically useful;
- median or p50;
- p90, p95, and p99 appropriate to volume;
- histogram or distribution shape;
- segment and intersection;
- cold and warm state;
- success, abstention, degradation, and error state;
- component and end-to-end values.
Percentiles require enough observations. A p99 from ten requests is simply the maximum under a calculation rule, not a stable estimate of a population tail. Keep sample size and uncertainty visible.
Fan-out makes tails consequential. When a request waits for several parallel components, one slow outlier can dominate completion. More branches increase the chance that at least one falls into its tail. Distributed-system research demonstrates why tail mitigation and distribution-aware analysis matter, while the exact benefit and cost remain architecture-specific. [CLM-071]
Do not compare a component p95 directly to the end-to-end p95 by addition. Percentile observations do not necessarily occur on the same request. Trace the joint path or simulate from measured distributions and validate with end-to-end observation.
Patchwork keeps image-mobile separate. Its synthetic p95 is 1,360 milliseconds, while common text paths are much faster. The aggregate mean remains below that tail and would support the wrong decision if reported alone.
A budget has both allocation and enforcement
Allocation says how much time or cost a stage may consume. Enforcement says what happens at the boundary.
For each component budget, define:
- target and hard deadline;
- percentile and measurement window;
- relevant segments and states;
- whether work is serial, parallel, or asynchronous;
- cancellation behavior;
- retry allowance;
- fallback and quality effect;
- capacity or quota consumed;
- owner and alert response;
- evidence version and expiry.
A 240 millisecond retrieval budget means little if the caller waits indefinitely. A hard cutoff means little if the fallback discards permission filtering. Performance controls must preserve semantic controls.
Budget from the end inward. Reserve time for validation, rendering, and truthful failure behavior. Teams often allocate the whole target to a model call, then treat application and network delay as surprises. The user does not.
Critical-path work receives stricter attention than optional work. Patchwork can omit a generated explanation under pressure while retaining filtered candidate evidence. It cannot omit authorization, freshness, or compatibility validation merely to meet a target.
Capacity is the ability to preserve behavior under demand
Throughput measures completed work per time. Capacity is the sustainable demand envelope under declared quality, tail, and failure conditions. Concurrency is work in progress. They are related, not interchangeable.
If average service time rises while arrival rate holds, concurrency grows. Queues add waiting before processing. Saturation appears when a constrained resource cannot accept more work without tail growth or rejection. A system can show modest CPU use while a provider quota, connection pool, accelerator, database lock, or human-review queue saturates.
Define capacity by configuration and state:
- requests per second or jobs per interval;
- peak and sustained concurrency;
- queue depth and maximum wait;
- provider or internal quotas;
- cold-start rate;
- cache hit and miss mix;
- batch size and formation delay;
- retry and fallback volume;
- request size or modality;
- quality and error gates held under load.
Capacity testing that sends identical tiny text prompts with a warm cache does not support an image-heavy mobile claim. Preserve request distributions and critical segments.
The right capacity question is not “How many calls can the model serve?” It is “At what demand can this combined product preserve its declared behavior, tail, permission, freshness, and stop conditions?”
Queueing makes small changes nonlinear
As utilization approaches a bottleneck’s sustainable limit, waiting can grow quickly. The exact curve depends on arrival and service distributions, scheduling, batching, and architecture, but the operational lesson is stable: headroom matters.
Plan capacity with:
- normal variance;
- peak events;
- dependency slowdown;
- retries during partial failure;
- circuit transitions;
- reindex or batch work;
- canary duplication;
- observability overhead;
- operator and reviewer capacity.
Do not spend all headroom on nominal throughput. Failure controls need room to operate. If one dependency slows, retries and queues can amplify the same incident. Bounded retries, backoff, jitter, and idempotency reduce specific risks but still consume resources. [CLM-072]
Patchwork’s synthetic calculation shows 100 requests with a 20 percent retryable-failure rate and two maximum attempts becoming 120 calls. That 1.2 amplification excludes any retry at another layer. Assign one retry owner and budget its worst bounded contribution.
Cold and warm are different products
Warm paths may reuse model processes, indexes, connections, compiled code, or caches. Cold paths may load weights, create connections, decode larger inputs, or miss stored features. Report the mix instead of publishing the best state as normal.
Cold behavior can correlate with segments. Infrequent languages, long-tail items, low-traffic regions, and unusual modalities may receive fewer warm-cache benefits. Aggregate cache hit rate can therefore conceal unequal latency or quality.
Record cache state on traces and in load fixtures. Keep at least these cohorts:
- text warm;
- text cold;
- image warm;
- image cold;
- denied permission;
- stale source;
- degraded dependency;
- repeated or reconciled request.
The last three are important because fast rejection or stop states can lower averages. A system that quickly denies evidence is not necessarily better than one that successfully serves a supported request.
Caching is a semantic decision
A cache key encodes an equivalence claim: these requests may reuse this result. For applied AI, equivalence can depend on user authority, source permission, freshness, locale, device, personalization, model version, policy version, and evidence state.
A broad shared cache improves hit rate but can cross permission boundaries or return stale context. A user-keyed cache protects separation but reduces reuse and can increase privacy exposure if identifiers are embedded carelessly. A feature cache may remain valid longer than a final answer. A generated explanation can become invalid when any supporting evidence changes.
For each cached object, record:
- object and purpose;
- key dimensions;
- permission scope;
- freshness source and expiry;
- invalidation triggers;
- model, data, schema, and policy versions;
- encryption and access;
- personalization meaning;
- fallback behavior on miss;
- quality and latency evidence.
Personalization can improve relevance while reducing cache reuse and increasing serving complexity. First-party product cases illustrate the tradeoff, but their outcomes do not transfer automatically to Patchwork. [CLM-075]
Patchwork selects a permission-and-freshness-keyed cache. It leaves a cold image-mobile tail. That is a named residual risk, not a reason to broaden equivalence silently.
Batching trades processing efficiency for waiting and coupling
Batching can improve accelerator or provider utilization. It can also delay the first request while the batch forms, mix request classes, complicate cancellation, and create larger failure units.
Evaluate:
- maximum batch formation time;
- maximum items and bytes;
- compatible permission and privacy scope;
- modality and size distribution;
- deadline-aware scheduling;
- partial failure handling;
- result correlation and ordering;
- tail effect under light load;
- quality changes from padding, truncation, or shared context;
- recovery after batch rejection.
Batching background indexing work differs from batching interactive answers. The same batch size should not be assumed. A configuration that raises throughput but violates interactive p95 or couples authorized and unauthorized data is not acceptable.
Cost is larger than tokens
Token or inference charges can be important, but total cost includes:
- source acquisition and permission work;
- labeling and domain review;
- storage and indexing;
- embedding and re-embedding;
- model calls and tool calls;
- retries, hedges, and duplicate work;
- evaluation and experiment execution;
- observability collection and retention;
- human feedback and adjudication;
- incident response and reconciliation;
- security, privacy, and compliance work;
- engineering maintenance and migration;
- user support and repair.
A cheaper call can increase total cost if it creates more errors, review, or churn. A more expensive validation can reduce consequence and incident load. Cost accounting should connect to behavior.
Use synthetic cost units when teaching the method. Convert to current prices only in a dated adapter with region, volume, contract terms, input/output assumptions, and access date. Provider documentation and deprecation notices change, so model choice evidence needs explicit version and expiry. [CLM-076]
Never present a timeless provider price table as an architectural truth.
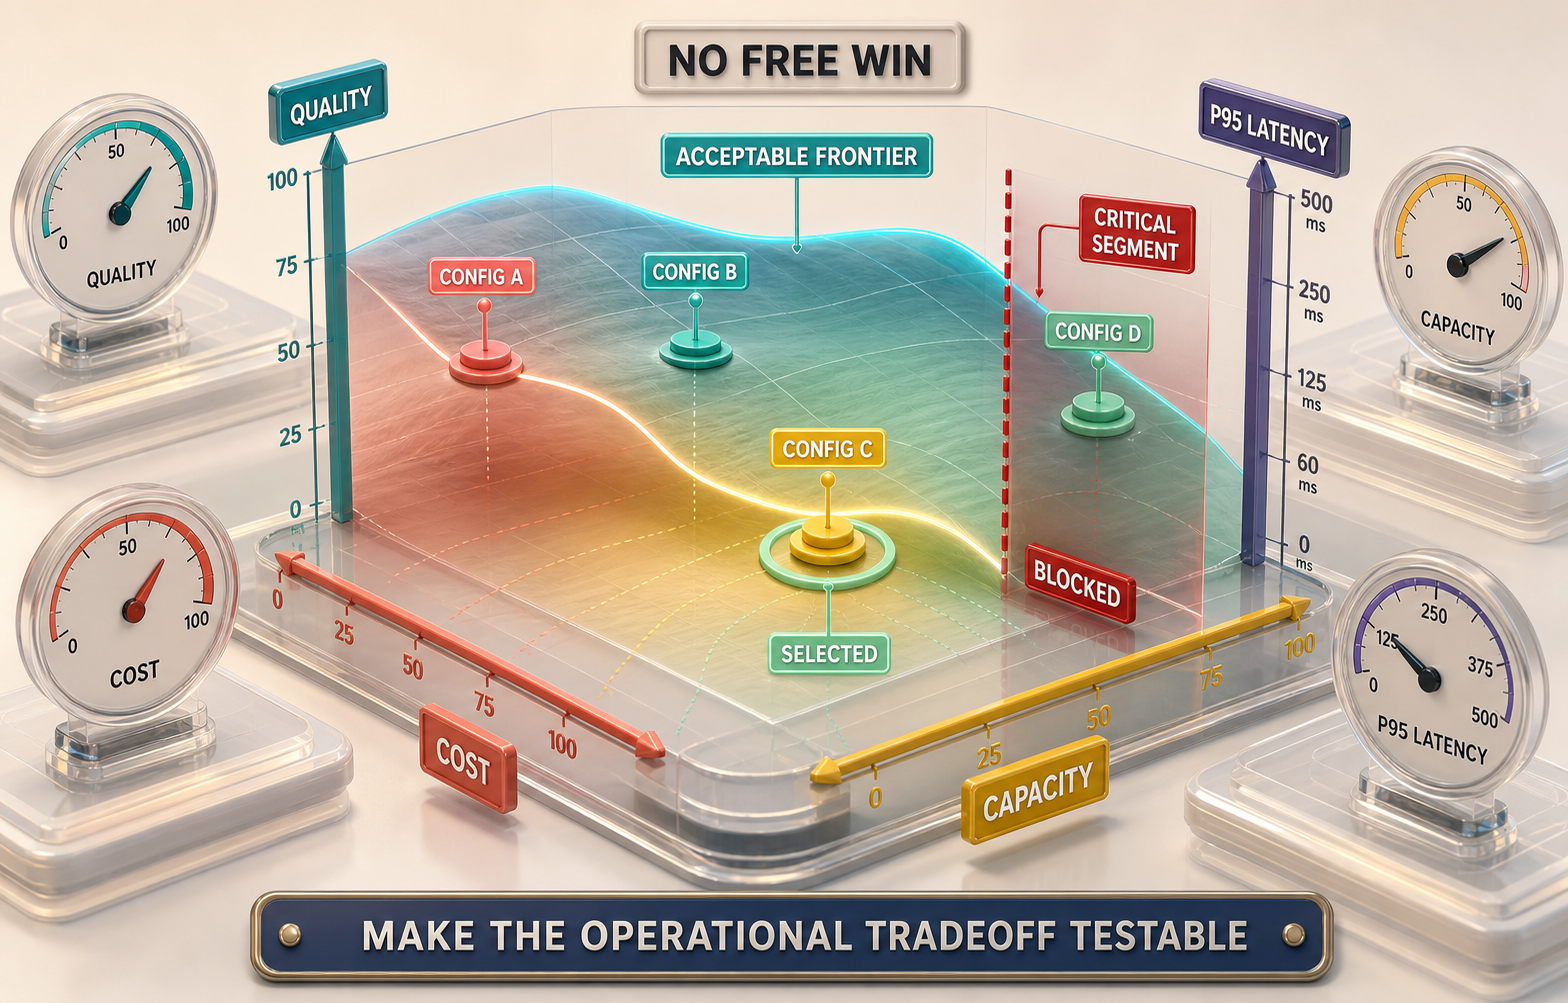
Quality, latency, capacity, and cost form a frontier
Optimization rarely produces a free win. A change can dominate another configuration on the measured dimensions, but often it moves the system along a frontier.
Patchwork compares three fictional configurations:
| Configuration | Quality | p95 | Capacity | Cost units | Critical recall | Named risk |
|---|---|---|---|---|---|---|
| evidence-first | 0.88 | 910 ms | 22 rps | 14 | 0.86 | cold image-mobile tail |
| fast-aggregate | 0.82 | 690 ms | 39 rps | 11 | 0.69 | permission, freshness, critical segment |
| high-recall | 0.91 | 1,240 ms | 14 rps | 21 | 0.90 | tail, saturation, retry load |
The fastest option fails the critical-segment floor and uses a broad cache with permission and freshness risk. The highest-quality option exceeds tail and cost budgets and offers weak capacity headroom. evidence-first passes the declared gates while retaining a named tail risk.
The selection is local to this synthetic envelope. A different task, consequence, or demand distribution could select differently.
Retrieval architecture exposes an effectiveness-efficiency frontier
Candidate generation and ranking create different resource profiles. Approximate nearest-neighbor methods trade exact recovery and resource use for scalable search. Late-interaction architectures demonstrate another effectiveness-efficiency choice. Multimodal retrieval adds image processing, representation storage, and potentially different serving paths. These mechanisms provide evidence about possible designs, not a guarantee of product relevance. [CLM-074]
Measure retrieval at several levels:
- index build time and resource use;
- index size and update delay;
- candidate latency and recall proxy;
- filter and permission cost;
- reranking latency and quality;
- end-to-end behavior and consequence;
- cold, warm, text, image, and long-tail segments;
- failure and stale-index paths.
A faster approximate index that drops the only compatible candidate in a critical segment is not an improvement under that contract. A slower ranker that adds no decision-changing quality is not justified by sophistication.
Shared rankers can reduce maintenance duplication and improve reuse, yet create coupling between products, objectives, and release schedules. First-party reports can motivate the option, but Patchwork needs its own serving and change evidence. [CLM-075]
Degradation must keep evidence and control
Performance pressure often produces a dangerous instruction: skip the slow thing. Whether this is safe depends on what the thing does.
Potentially removable under a declared degraded mode:
- generated explanation;
- optional personalization;
- noncritical enrichment;
- secondary reranking when primary evidence remains adequate;
- high-resolution preview.
Usually not removable merely for speed:
- authorization;
- permission filtering;
- freshness validation;
- compatibility constraints;
- output validation;
- effect confirmation;
- critical segment guardrails.
Every optimization names the semantic or privacy assumption it risks. Faster caching risks equivalence and freshness. Larger batches risk waiting and isolation. Fewer candidates risk recall. Smaller models risk quality. More retries risk capacity and cost. Truncated context risks evidence loss. Reduced logging risks diagnosis. More logging risks privacy.
A fast ungrounded answer is not a graceful fallback. When evidence is unavailable, Patchwork reduces capability or abstains.
Observe service health without confusing it with quality
Latency, traffic, errors, and saturation are foundational operational signals. They reveal user-facing delay, demand, failed requests, and capacity pressure. They are necessary and not sufficient for applied AI product quality. [CLM-073]
A service can be green while:
- candidates are irrelevant;
- compatibility evidence is stale;
- abstention grows in one segment;
- explanations overstate certainty;
- permission filtering excludes valid evidence;
- users repeatedly correct the same behavior;
- a cheaper configuration increases consequential error.
Join resource traces to behavior state, failure layer, evidence IDs, component versions, and segment codes. Chapter 15 defines that signal lattice without default raw-content logging.
Design a reproducible load and cost experiment
The experiment packet needs:
- decision and possible dispositions;
- frozen configuration versions;
- traffic shape and request mix;
- modality, size, and segment distribution;
- arrival pattern and concurrency;
- warm-up and cold-start rules;
- cache and batch policy;
- retry and failure injection;
- measurement clock and percentile method;
- synthetic cost accounting;
- quality and policy gates;
- stop conditions;
- known confounds;
- repetition and result hash;
- authority required for production inference.
Run at least three configurations. Preserve request-level results long enough to compute distributions and inspect outliers, using privacy-conscious synthetic or authorized data. Do not retain only a summary chart.
Check implementation before interpreting performance. Confirm that each configuration actually used its declared model, cache, batch, retry, and validation path. A surprisingly fast run may have skipped work or reused unintended state.
Separate benchmark effects. The first run may populate caches or compile code. Randomize or balance configuration order where appropriate. Repeat enough to see variation. State what the fixture cannot establish.
Interpret the Patchwork synthetic report
The companion fixture contains ten constructed requests across text warm, text cold, image mobile, denied permission, and stale source states. Its aggregate p95 is 1,360 milliseconds because nearest-rank p95 on ten samples selects a tail observation. The image-mobile segment contains the slow and quality-failing cases.
This demonstrates three lessons.
First, a low aggregate mean does not satisfy a tail budget. Second, the segment connects the tail to a product path rather than an anonymous outlier. Third, fast denied and stale-source stops should not be counted as normal successful speed.
The fixture is intentionally too small for a production capacity claim. It verifies reporting mechanics: raw request rows remain available, percentiles reproduce, segments stay separate, three configurations name risk, and the selected configuration passes declared gates.
A practical budget review
User-time boundary
- What starts and stops the clock?
- When is output usable rather than merely received?
- Which work continues after response?
- Are failure and reconciliation paths included?
Distribution
- Which percentiles and histograms are reported?
- Is sample size adequate for the percentile claim?
- Which segment or state owns the tail?
- Are cold and warm results separated?
Capacity
- What bottleneck limits sustainable demand?
- What headroom remains for retries and incidents?
- Does quality remain within gates under load?
- Are human queues included where relevant?
Cost
- Which lifecycle and incident costs are excluded?
- Are units dated and versioned?
- Does a cheaper path increase review or error cost?
- Is duplicate work visible?
Semantics
- What equivalence does the cache key claim?
- What assumption does batching introduce?
- Which evidence or control is removed by degradation?
- Can a faster result become less authorized or less fresh?
Decision
- Which configurations are dominated?
- Which tradeoffs remain on the frontier?
- Which gate determines rejection?
- Who may accept the residual risk?
Construct the measurement clock carefully
Performance disputes often begin with different clocks. A browser measures from interaction to rendered content. A gateway measures from request receipt to response bytes. A provider reports internal processing. Each can be correct and still answer a different question.
Define timestamps for:
- user intent accepted;
- upload started and completed;
- authorization completed;
- queue entered and left;
- each dependency call started and ended;
- first useful candidate available;
- validation completed;
- first byte and complete payload delivered;
- interface became usable;
- background or effect work completed.
Use a monotonic clock for durations within one process. Use synchronized wall time for cross-system correlation and record uncertainty. Do not subtract timestamps from poorly synchronized hosts and present the result as precise.
Measure cancellation. If the user leaves after 500 milliseconds but downstream work continues for 30 seconds, user latency and resource cost diverge. The trace should preserve both. Cancellation that reaches a provider can release capacity; cancellation that only closes the interface cannot.
Streaming adds another distinction. Time to first token or first candidate may improve perceived responsiveness while time to verified useful output remains unchanged. A stream that later retracts invalid content can create worse behavior despite a fast first byte. Report first useful verified result where that is the product contract.
Design histograms and percentiles for the decision
A histogram needs stable boundaries and meaningful units. Buckets that end at 500 milliseconds cannot diagnose a 1.3-second tail. Buckets that are too fine can create cost and cardinality without improving a decision.
Choose boundaries around:
- user-experience thresholds;
- component deadlines;
- fallback transitions;
- service objectives;
- known cold-start ranges;
- reconciliation deadlines.
Keep timeout observations. Dropping them from latency because they did not complete makes the distribution look better as reliability worsens. Represent them as censored or terminal observations with the timeout threshold and behavior state.
Percentiles across unequal traffic segments weight high-volume groups. That is correct for an all-request distribution but insufficient for critical segments. Report segment distributions separately and include counts. A high p99 in a tiny but consequential cohort deserves action even when it barely affects aggregate values.
Compare windows with the same method. Switching from client latency to server latency or from all requests to successes can create an artificial improvement. Version the metric definition next to the system version.
Model the entire workload, not an average request
A reproducible workload describes a distribution of work. Include:
- modality and payload size;
- language and locale where relevant;
- text length or image dimensions;
- candidate count and index partition;
- personalization and permission state;
- cold and warm resources;
- successful, abstained, degraded, and stopped behavior;
- burst and steady arrival patterns;
- user cancellation;
- dependency slowdown and failure;
- background maintenance;
- version and region.
Use synthetic fixtures to test mechanics safely. Use authorized sampled or replayed distributions to support production claims. Preserve the boundary between them.
Traffic replay can reproduce arrival patterns but may not reproduce downstream state. A cache, provider, or index can differ. A load generator can create concurrency but not human think time or abandonment. State these limitations.
For Patchwork, the image-heavy cohort must include decode, embedding, retrieval, and interface transfer. A text-only benchmark cannot stand in for it. Denied-permission and stale-source fixtures verify that fast stops are not misclassified as successful speed.
Capacity experiments need controlled stages
Begin below expected load and increase in steps. At each stage, wait for a defined steady window or record why no steady state exists. Measure arrival, completion, queue, saturation, retries, tail, cost, and behavior quality.
Stop when:
- critical behavior gate fails;
- p95 or p99 exceeds its hard envelope;
- queue grows without recovery;
- saturation crosses the declared safe limit;
- dependency or provider quota is threatened;
- error or retry amplification exceeds policy;
- observability loses request accounting;
- the synthetic cost ceiling is reached.
The maximum completed throughput after quality has already failed is not useful capacity. Report the last stage that held all required gates and the first stage that failed each gate.
Run recovery after overload. A system may process new requests while a backlog continues to harm old ones. Circuits, queues, and caches can remain in altered state. Capacity includes returning to acceptable operation.
Concurrency controls preserve scarce work
Admission control rejects or defers work before a saturated component. A concurrency limit bounds in-flight calls. A queue smooths short bursts but adds waiting. Priority scheduling can protect critical tasks but risks starvation.
Define priority from product consequence, not from who shouts loudest. A compatibility validation may outrank optional explanation generation. A user-visible correction may outrank background re-embedding. Avoid using sensitive user categories as priority without explicit authority and review.
Per-tenant or per-operation limits can reduce noisy-neighbor effects. Global limits protect shared dependencies. Both may be needed. A limit that exists only in the client cannot protect the service from many clients.
When admission fails, use the Chapter 13 fallback ladder. Return a truthful reduced or stopped state. Do not queue interactive work beyond the user’s useful window and then deliver a stale answer.
Cache experiments must test invalidation
A hit-rate chart is incomplete. Exercise:
- source freshness expiry;
- permission revocation;
- user or tenant boundary change;
- model, prompt, schema, and policy version change;
- corrected compatibility data;
- item deletion;
- negative result caching;
- fallback result caching;
- simultaneous invalidation load.
Measure invalidation delay and stale-read exposure. Verify that a denied user cannot infer the existence of another user’s cached result through content, timing, or identifiers. Check whether cache warming uses data under an allowed purpose.
Negative caches deserve attention. Caching “no result” can preserve a temporary retrieval failure after recovery. Give negative states shorter, reason-specific validity and include dependency state in the key where appropriate.
Do not cache unknown effect states as final failure. Reconciliation owns that state.
Batching experiments must preserve deadlines and isolation
Use request classes with compatible deadlines. If a short interactive request shares a batch with a large background job, batch efficiency can worsen user latency. A deadline-aware scheduler may dispatch an underfilled batch to protect tail.
Check partial outcomes. If one item violates schema or permission, does the entire batch fail? Can valid results be safely separated without leaking associations? Are response indices stable under retry?
Measure formation time separately from processing. A high-throughput benchmark with prefilled batches hides formation delay under real light traffic. Run both burst and sparse arrival patterns.
Record whether batching changes model behavior through padding, truncation, shared context, nondeterminism, or memory pressure. Efficiency evidence is incomplete without quality replay.
Hedging and speculative work have semantic cost
A hedged request starts another attempt before the first finishes. It can reduce tails in some read-only systems, but doubles work for a subset and can worsen overload. The attempts may return different learned outputs, creating a selection policy.
Before hedging, define:
- eligible read-only operations;
- delay before the hedge;
- maximum attempts;
- cancellation of the loser;
- capacity gate;
- result selection semantics;
- duplicated logging and cost;
- privacy implications of sending content twice;
- prohibition for non-idempotent effects.
Selecting the first result optimizes speed, not necessarily quality. Selecting by a score adds another evaluator and latency. If equivalent evidence cannot be shown, omit hedging from the supported path.
Account for review and incident capacity
Human work is a capacity surface. A degradation policy that routes ten percent of peak traffic to review can create an impossible queue. Model:
- reviewers available by time and region;
- service time distribution;
- required competence;
- escalation and handoff;
- maximum age before a task becomes useless;
- rework and disagreement;
- privacy access burden;
- surge staffing authority.
Incident work also has cost. Complex fallbacks, multiple providers, and custom caches increase on-call diagnosis and migration effort. Include these in total-cost comparison even if they are initially qualitative.
A configuration with slightly higher compute cost may be preferable if it reduces recurring manual reconciliation. Conversely, a cheap automated path may be unacceptable if it externalizes correction to users.
Create a resource decision memo
After the experiment, write a compact memo:
Decision. Select, revise, reduce scope, or reject a configuration.
Evidence identity. Workload version, configuration versions, source snapshot, metric definition, run time, environment, and result hash.
Quality. Aggregate and critical-segment behavior gates, including abstention and consequential errors.
Latency. End-to-end and components, distribution, tails, cold/warm, and timeout handling.
Capacity. Sustainable stage, headroom, bottleneck, queue, retry amplification, and recovery.
Cost. Synthetic or dated actual units plus lifecycle and human work included or excluded.
Semantic risks. Cache equivalence, freshness, permission, batching, truncation, degradation, and provider change.
Negative evidence. Configurations and segments that failed, preserved without averaging away.
Residuals. Unknown population, real network, provider variability, demand shape, and maintenance burden.
Authority. Who can accept the choice and when evidence expires.
For Patchwork, the memo selects evidence-first, preserves the image-mobile tail as a required improvement, rejects broad shared caching, and forbids ungrounded fast fallback.
Common optimization disputes
“The mean improved, so most users are faster.” Not necessarily. Inspect the distribution and paired request cohorts. A changed mix can lower mean while a critical tail worsens.
“Caching is only an implementation detail.” The key asserts equivalence across permission, freshness, personalization, and versions. That is product semantics.
“More retries improve reliability.” Only under bounded transient conditions. During overload, they can reduce successful capacity.
“The expensive model has the best quality.” Which quality, cases, segments, and threshold? Total cost and operational behavior remain separate evidence.
“We can remove validation to meet latency.” If validation enforces a required invariant, this changes the supported behavior, not merely speed.
“The provider benchmark proves throughput.” It proves a dated configuration under specified conditions. End-to-end Patchwork capacity includes its own data, network, controls, and workload.
“A p99 target is always more rigorous.” A percentile without sufficient volume, stable definition, and action can be decorative. Choose the statistic that supports the consequence and demand.
Work an end-to-end budget example
Assume a fictional 950 millisecond p95 target for Patchwork’s supported interactive discovery path. This is a teaching value, not measured performance.
Reserve 170 milliseconds for interface and network delivery, 90 for final validation, and 70 for input processing and authorization. That leaves 620 milliseconds for retrieval, ranking, and any explanation work on the critical path.
Allocate 240 milliseconds to retrieval and 120 to ranking. The remaining 260 milliseconds cannot automatically become a model timeout. Explanation is optional and can stream only after the candidate set and evidence pass validation. If explanation exceeds its sub-budget, the product can return evidenced candidates in a visible reduced-capability state.
Now inspect the graph. Retrieval and some input feature work may run concurrently, so allocations do not simply sum. Network delay may overlap response parsing. A permission check may be cached, but its cache key has authority and expiry semantics. Validate the allocation with traces rather than arithmetic alone.
Inject one retrieval timeout. A second attempt would require 40 milliseconds of backoff plus call time. If only 100 milliseconds remains, the retry cannot finish inside budget. The correct behavior is reduced capability or abstention, not letting the call overrun and erasing validation time.
Inject saturation. Queue delay adds 180 milliseconds before retrieval. The component itself still meets its processing target, yet end-to-end p95 fails. This is why queue time belongs in the user’s clock and why component dashboards can all appear green.
Inject a warm broad-cache hit. Latency drops, but the object was keyed without permission version. The result fails the semantic gate despite superior speed. The optimization is rejected.
The example shows that allocation, concurrency, fallback, and semantics must be evaluated together.
Treat cost and latency as random variables with conditions
One request can invoke different work depending on candidate count, output length, cache state, retry, modality, and fallback. A single cost-per-request value hides that distribution.
Record conditional cost:
- ordinary successful path;
- cold path;
- image-heavy path;
- long-tail retrieval;
- one bounded retry;
- degraded response;
- abstention before expensive work;
- unknown effect reconciliation;
- evaluation or shadow duplication.
Report mean and tail cost, not only total divided by requests. A few runaway outputs or retry storms can dominate spend. Join cost to behavior so cheaper failure does not appear attractive merely because it stopped early.
Forecasts should state demand, mix, growth, seasonality, and uncertainty. Provide low, expected, and high scenarios. Keep provider rates in a dated input table so architecture logic does not require prose changes whenever prices move.
Segment intersections without an explosion
The full cross-product of region, device, modality, language, cache state, permission, and version can create thousands of sparse cells. Predeclare intersections tied to a plausible mechanism or consequence.
For Patchwork, image-mobile x cold is plausible because image processing and network transfer affect the tail. denied-permission x warm-cache is plausible because cache equivalence can expose unauthorized reuse. long-tail x stale-source is plausible because infrequent records may update slowly.
Use hierarchical review. Monitor major segments continuously, inspect mechanism-linked intersections, and preserve rare critical cases even when rates are unstable. Report counts and avoid rankings based on tiny denominators.
If a segment cannot be observed without collecting sensitive data, consider synthetic testing, controlled studies, privacy-preserving aggregation, or a stated evidence gap. Do not silently assume uniform behavior.
Budget maintenance after launch
A resource envelope is versioned operational evidence. Revisit it when:
- model, provider, index, prompt, or tool changes;
- source size or modality mix changes;
- a new region or device class launches;
- permission or personalization affects cache keys;
- retry, timeout, circuit, or fallback changes;
- traffic shape or peak grows;
- a new evaluation or observability step enters the path;
- prices, quotas, or deprecations change;
- incidents reveal an unmodeled state.
Compare the new envelope to the previous one with paired workloads where possible. Preserve regressions even if the new aggregate looks better. If the system changes faster than evidence can be renewed, reduce scope or freeze the affected path.
Budget ownership should be distributed but coordinated. Component owners maintain local evidence. A product-level owner maintains the end-to-end clock and quality envelope. Finance or platform staff may supply cost inputs. Privacy and security owners review cache, trace, and provider implications. Release authority decides whether the combined evidence permits exposure.
Publish a dated adapter sheet beside the durable envelope. It can contain current provider rates, quotas, region availability, named model versions, observed throughput, and contract assumptions. Mark every value with source, access date, currency or unit, volume tier, and expiry. Keep these numbers out of the architectural rule itself.
When an adapter changes, rerun the decision rather than swap one number in a spreadsheet. A cheaper provider may require a different retry policy, data transfer, observability path, cache, or fallback. A higher quota can shift the bottleneck into retrieval or review. A deprecation can force migration before enough paired evidence exists. The versioned adapter makes those changes visible without pretending they are permanent facts.
Also maintain a capacity reservation table for failure modes. Reserve bounded room for one retry tier, half-open circuit probes, rollback traffic, and essential observability. Keep optional explanation, shadow evaluation, and background indexing in shed-able classes. During overload, the scheduler can protect contract-critical work because priorities were decided before the incident.
Review the envelope with product language. Explain which users wait, which capability degrades, which evidence remains, and which path stops. A budget that only platform engineers understand cannot reliably govern user behavior. The final acceptance statement should name the supported population, request states, tails, quality gates, cost assumptions, and unresolved segments in one place.
Keep the failed configurations in the packet. Their fast aggregate, expensive high-recall, or overloaded states are negative evidence that helps future engineers understand why the selected point exists. If a later change removes one constraint, rerun the comparison with the same preserved cases before claiming the old rejection no longer applies. This continuity turns performance work into cumulative engineering evidence rather than a sequence of disconnected benchmark screenshots.
Make every renewed comparison reproducible, reviewable, and decision-bound.
What the companion proves
Run:
node --test content/publications/applied-ai-engineering/companion/tests/chapter-14.test.mjsThe tests establish that:
PF-09v0.2 contains three complete synthetic configurations;- nearest-rank percentiles preserve a constructed slow tail;
- aggregate and image-mobile reports remain separate;
- the fast configuration fails critical-segment and cache-semantics gates;
- the selected configuration passes declared gates and retains a named risk;
- retry amplification remains explicit.
They do not establish production throughput, statistical tail stability, real provider price, user-perceived quality, real cache safety, or release authority.
From budgets to privacy-conscious diagnosis
A budget turns resource behavior into a product decision. It begins at the user’s clock, preserves distributions and segments, includes failure load, and refuses optimizations that discard evidence, permission, freshness, or control.
The team now knows that the image-mobile tail fails while aggregate health looks acceptable. It knows which configuration passes the current envelope and which risks remain. The next question is operational: how will the team detect this behavior, correlate it to versions and context, and diagnose it without routinely collecting the user’s raw image or text?
Chapter 15 builds that signal and trace design.