Observe Behavior Without Betraying Users
Build decision-bearing signals, redacted traces, feedback paths, retention controls, and diagnostic views that reveal product behavior without routine raw-content surveillance.
Green service, failing behavior
Patchwork’s service dashboard is green. Uptime is high. Error rate is low. Most requests finish inside the service latency target.
Image-mobile users are increasingly receiving degraded or abstained results because evidence coverage fails after image processing. The service returns valid responses quickly. The product behavior is failing for a critical segment.
Operations cannot diagnose this from status codes and latency alone. Product analytics cannot explain it from clicks alone. A raw log of every image and response would create unnecessary privacy and security risk and might still obscure the causal layer.
Applied AI observability needs a signal lattice that separates:
- user task and outcome;
- product interaction;
- behavior and error taxonomy;
- segment and context state;
- retrieval and evidence;
- model and version;
- tool and effect;
- control state;
- service and dependency health;
- capacity, latency, and cost;
- selected qualitative feedback.
The lattice supports correlation without claiming that one proxy explains another. It starts with purpose and decision, not with collecting everything.
This chapter advances PF-09 to v0.3. The companion defines six decision-bearing signals, an allowlisted redacted trace, fictional access and retention controls, deletion evidence, a selected-feedback route, and a diagnostic view that finds a failing segment while service health remains green.
Observability is the ability to answer a decision question
Telemetry is collected data. Observability is the practical ability to infer relevant internal and product states from available evidence. A dashboard is a view. Monitoring applies thresholds and response rules. Diagnosis connects symptom to plausible cause. These terms overlap in practice, but separating them improves design.
Start with a decision question:
- Should we degrade or stop this behavior?
- Which component or context state explains the symptom?
- Did a new version change a critical segment?
- Are retries amplifying capacity and cost?
- Did a permission or freshness control contain exposure?
- Does this qualitative report represent a known error category or a new one?
- Which traces must be deleted under the declared policy?
If a field does not support a named decision, control, audit need, or bounded investigation, challenge its collection. “It might be useful” is not an adequate purpose for sensitive content.
Production monitoring should connect user-visible symptoms, internal causes, and actions. Black-box signals show what a user or external observer experiences. White-box signals expose internal state. Golden service signals help teams observe latency, traffic, errors, and saturation, but applied AI usefulness requires additional behavior and context evidence. [CLM-077]
Build a signal lattice, not one success metric
A single north-star metric invites category collapse. Click-through can increase while evidence quality falls. Abstention can increase because a control is correctly blocking stale data or because retrieval coverage regressed. Low error rate can coexist with systematic failure in a small segment.
Use layers.
User task and outcome
Did the person complete the intended task? Did they need correction, repetition, or another channel? Outcome evidence is closest to value but often delayed, ambiguous, and influenced by factors outside the system.
Product interaction
Which behavior did the user see? Did they inspect evidence, revise input, choose an item, dismiss, or abandon? Interaction describes use. It does not automatically explain satisfaction or correctness.
Behavior and error
Which declared state occurred: respond, clarify, abstain, degrade, review, or stop? Which error taxonomy applies? Was a critical invariant violated? Behavior signals connect monitoring to the contract and evaluation suite.
Segment
Which predeclared cohort matters for diagnosis: modality, device class, region bucket, language, cold/warm state, long-tail item, permission state, or another justified dimension? Segment fields should be minimal, coded, and governed. They can become sensitive through combination.
Context and retrieval
Was evidence present, current, permitted, relevant, and sufficiently covered? Which evidence identifiers and index versions participated? Store stable IDs and state codes where they support diagnosis, not raw documents by default.
Model and component version
Which model adapter, prompt or policy version, ranker, schema, and data snapshot produced the behavior? Version correlation supports replay and change diagnosis. A version association is not proof of cause.
Tool, control, and effect
Was a tool merely proposed, confirmed, attempted, completed, rejected, or left unknown? Which authorization, idempotency, validation, and circuit controls ran? Effect state must remain distinct from response status.
Service, capacity, and cost
What were latency, traffic, errors, saturation, queue, retry, and synthetic or actual cost states? These diagnose operational constraints without standing in for product quality.
Feedback
Did a person submit correction, complaint, rating, or narrative? Feedback is selected evidence from people who encountered the interface and chose to respond. It is not a representative sample by default.
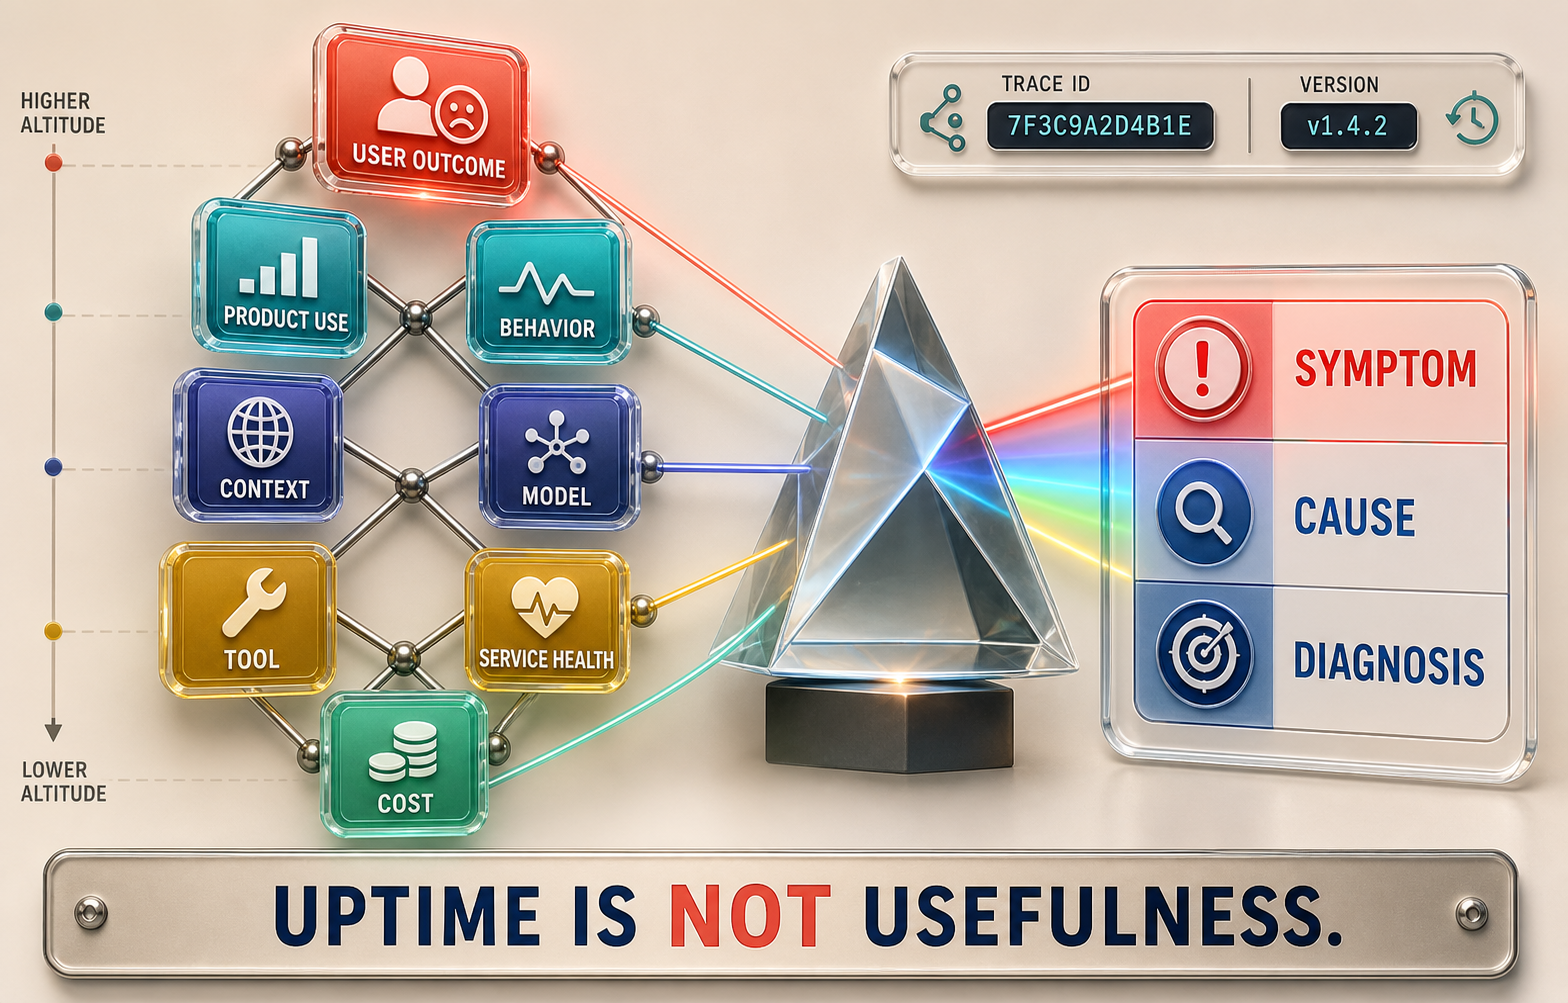
The lattice prevents two common errors. First, it prevents uptime from becoming usefulness. Second, it prevents one observed change, such as drift, from being declared the cause before competing explanations are tested.
Give every signal a job
The PF-09 catalog requires these fields:
| Field | Purpose |
|---|---|
| signal ID and layer | stable reference and semantic location |
| purpose | why collection is necessary |
| collection method | event, metric, trace, sample, or review |
| sensitivity | privacy and security handling class |
| owner | who maintains meaning and response |
| decision | what choice the signal can change |
| retention | how long the declared example keeps it |
| threshold | when investigation or control begins |
| blind spot | what the signal cannot establish |
Patchwork includes six fictional signals: task completion, behavior/error state, context status, service health, selected feedback, and cost/capacity. Each names one decision. This makes unused collection visible.
Signal definitions need version control. If abstain changes meaning, a historical trend may break. If a segment definition changes, pre/post comparison may become invalid. If instrumentation moves, a drop may reflect missing events rather than better behavior.
An owner is responsible for semantic integrity, not just dashboard uptime. They document numerator, denominator, inclusion, exclusion, delay, sampling, and known gaps. They also retire fields that no longer serve a justified purpose.
Trace by identity without storing the conversation
A trace connects operations belonging to one request or workflow. Useful correlation often requires identifiers and state codes, not raw content.
Patchwork’s allowlist includes:
- trace ID;
- timestamp;
- task code;
- segment code;
- behavior state;
- failure layer;
- evidence IDs;
- component versions;
- latency;
- cost units;
- effect state;
- policy flags.
It excludes by default:
- raw prompt or query text;
- raw output;
- raw user image;
- name and email;
- full IP address.
The allowlist is not automatically safe. Evidence IDs can reveal interests. Version and timestamp combinations can enable linkage. Segment intersections can become identifying. Access, sampling, aggregation, retention, and deletion still matter.
OpenTelemetry semantic conventions can improve technical consistency across traces, metrics, and logs, but technical conventions do not decide whether collecting user content is necessary, proportionate, lawful, or authorized. [CLM-079]
Use opaque identifiers where possible. Keep identity mapping in a separately controlled system only when needed. Do not place sensitive meaning in field names or free-form tags. Bound cardinality so one user or document identifier does not explode metric storage and exposure.
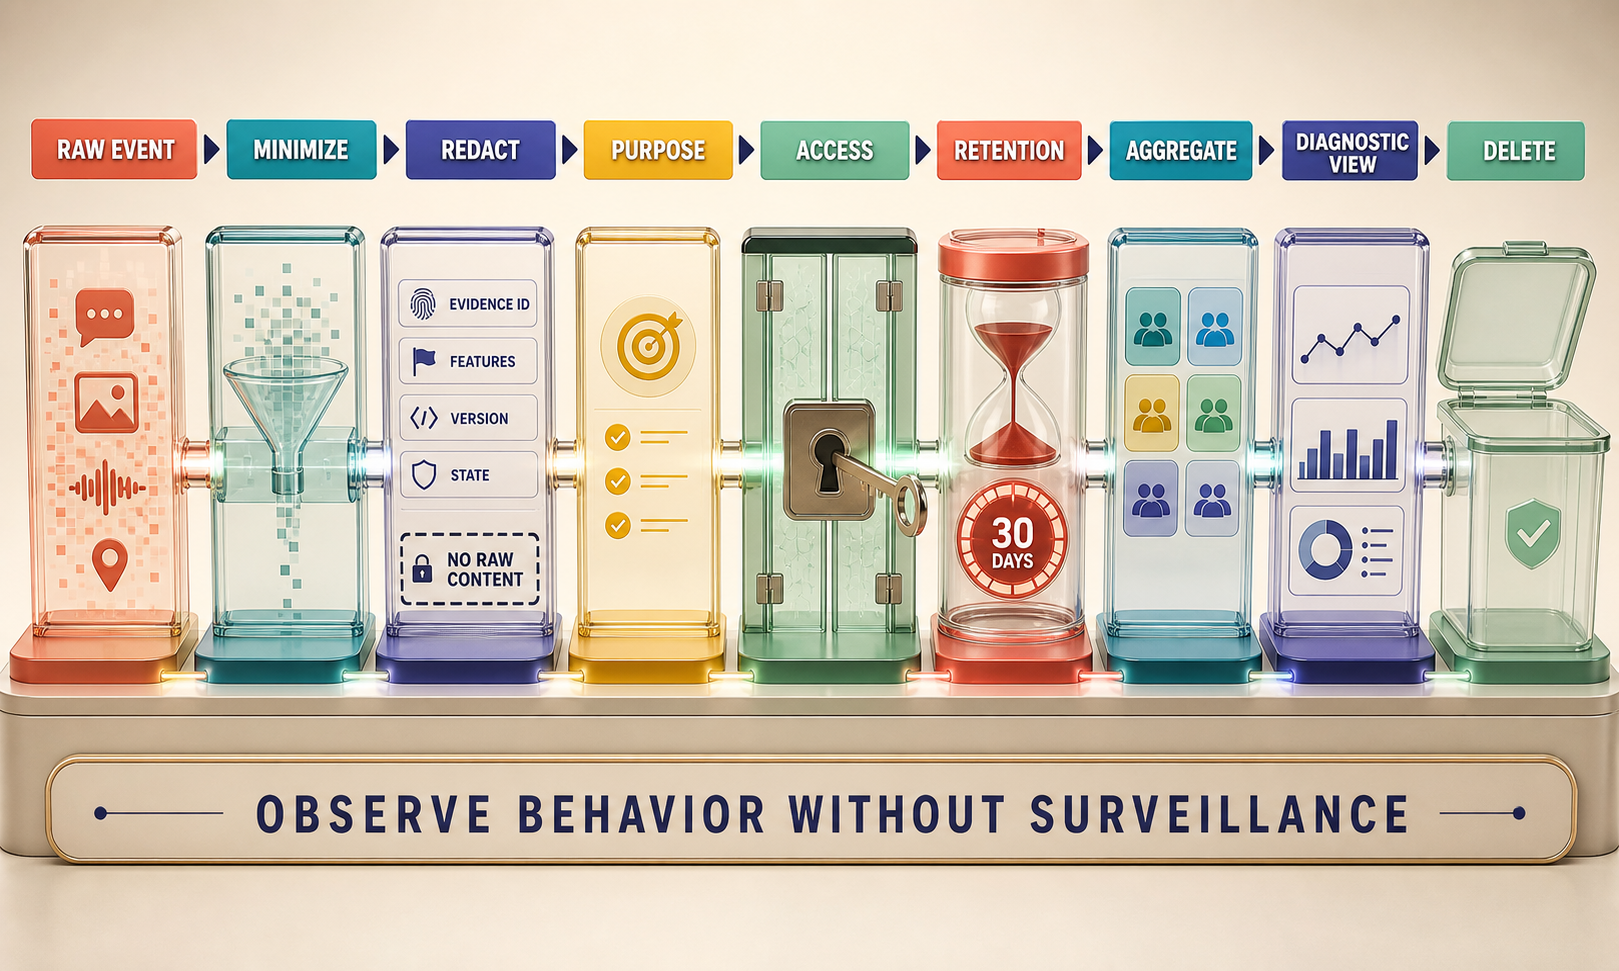
Minimize before redacting
Redaction is useful, but non-collection is stronger. A redaction system can miss new formats, encoded content, images, or sensitive combinations. Ask in order:
- Can the question be answered without this field?
- Can a categorical state replace raw content?
- Can a stable evidence ID replace a document body?
- Can aggregation or sampling reduce collection?
- If content is temporarily necessary, can access and retention be sharply bounded?
- Can synthetic reproduction replace production inspection?
Redact at the earliest trustworthy boundary. If raw data travels through several services before removal, those services, buffers, logs, and failure paths become part of the exposure surface.
Avoid free-form error messages in telemetry. Dependencies may echo user content. Map expected failures to controlled reason codes. Treat unknown exceptions as sensitive until reviewed.
For structured inputs, allowlist approved fields rather than maintain an endless denylist. For images, metadata and derived features may still be sensitive. Do not assume embeddings are anonymous. Their handling needs explicit purpose and threat review.
Privacy controls form a lifecycle
Privacy-conscious observability is not one redaction function. It includes purpose, collection, processing, access, retention, sharing, deletion, incident response, and communication. Risk frameworks support lifecycle thinking while remaining voluntary and not a substitute for law or formal authority. [CLM-080]
For each signal, document:
- stated purpose and prohibited reuse;
- data subject or affected group context;
- collection boundary;
- minimization and transformation;
- access roles and approval;
- storage and transport controls;
- retention trigger and deletion method;
- export and third-party transfer;
- sampling and aggregation;
- audit evidence;
- incident handling;
- applicable authority and unresolved legal questions.
Retention is not a number copied from another company or framework. It follows purpose, operational need, risk, applicable obligations, and authority. The companion’s example values are fictional policy inputs used to test deletion mechanics. They are not universal recommendations.
Deletion needs evidence
A retention policy without deletion execution is aspiration. Define the timestamp that starts the clock, the stores and replicas in scope, deletion or irreversible aggregation method, failure handling, and proof.
Patchwork’s synthetic deletion function receives redacted traces, a current time, and an authorized example retention period. It returns deleted count and retained trace identifiers. That proves deterministic fixture behavior only.
Real deletion may need to cover:
- primary trace store;
- indexes and materialized views;
- debug exports;
- data lake copies;
- backups under a defined process;
- alert payloads;
- incident tickets;
- model or evaluator samples;
- vendor systems;
- local downloads.
Legal hold or incident preservation can alter normal deletion, but it needs named authority and documented scope. Do not silently preserve everything “just in case.”
Test deletion. Create a synthetic or authorized canary record, wait or simulate expiry, run the process, and verify all declared stores. Record failures as operational evidence.
A dashboard should show disagreement
Dashboards often align panels around one positive story. A useful diagnostic view makes contradictions visible.
Patchwork places these together:
- service p95 and error rate;
- response, abstention, degradation, and stop rates;
- critical error count;
- evidence coverage and freshness state;
- permission denial state;
- component and policy versions;
- segment success rate;
- retry and circuit state;
- cost units;
- selected feedback categories.
The synthetic trace fixture creates a green service with an image-mobile success rate below 0.80. The diagnosis is green-service-failing-product-segment. This is the intended contradiction.
Use drill-down in stages. Begin with aggregate symptom, then segment, behavior state, failure layer, version, evidence state, and operational cause. Avoid beginning with raw user content. If deeper content inspection is justified, use an approved bounded workflow with access logging, sampling, and retention.
Views need owners and actions. A panel without a decision can distract during incidents. An alert that no one can act on creates fatigue.
Drift is an observation, not a diagnosis
Data and feature validation can detect schema anomalies, training-serving skew, and distribution change. ML production readiness also adds data and model tests beyond ordinary service checks. [CLM-078]
But change does not automatically mean degradation, and degradation does not automatically identify cause.
A distribution shift can be:
- expected seasonality;
- a measurement or instrumentation change;
- a source pipeline defect;
- a new user population;
- changed product positioning;
- adversarial manipulation;
- a harmless change in unused features;
- an important change that improves the task.
When a detector fires, ask which behavior and consequence moved. Compare versions, segments, context states, and evaluation replay. Preserve the null possibility that the detector is unrelated.
Likewise, stable input distributions do not prove stable behavior. Provider updates, policy changes, prompt changes, dependency failures, or user adaptation can alter outcomes.
Feedback is selected, contextual evidence
People who provide feedback are not a random sample. They may be unusually satisfied, frustrated, expert, motivated, or exposed to a particular interface. Feedback volume depends on prompt placement, friction, trust, and incentives.
Short-term engagement and preference can reward behavior that conflicts with evidence fidelity or longer-term consequence. First-party incidents and product reports illustrate how apparently positive signals can miss behavior problems, but they do not establish a universal relationship. [CLM-082]
Keep feedback types separate:
- explicit rating;
- correction;
- free-form report;
- support contact;
- observed abandonment;
- repeated query;
- downstream reversal;
- specialist review.
Do not collapse them into sentiment. A repeated query could indicate exploration or failure. A click could indicate relevance or misleading presentation. A correction is evidence about one interaction and can become a new evaluation case after review.
Patchwork’s feedback intake marks every report as selected and nonrepresentative. A critical report routes to adjudication and case construction. Lower-severity reports enter sampled review. Raw narrative is not placed in default traces.
Human-AI behavior changes over time
People learn the system, develop workarounds, calibrate trust, or stop using correction mechanisms. The system also changes. Human-AI guidance emphasizes correction, control, and adaptation across interaction rather than a one-time output. [CLM-081]
Observe behavior over time with caution:
- correction rate by behavior version;
- repeated failure category;
- time to recover from abstention;
- evidence inspection before action;
- override and reversal;
- support escalation;
- outcome after correction;
- segment-specific adoption and abandonment.
Longitudinal linkage can be sensitive. Use the least identifying method that answers the decision. Cohort aggregation may suffice. If individual continuity is necessary, define purpose, access, expiry, and user expectations.
Do not interpret lower correction as automatic improvement. The interface may have hidden the control, users may have lost trust, or the population may have changed.
Alerts must be actionable and bounded
An alert record needs:
- symptom and threshold;
- population and time window;
- current versions;
- likely but unconfirmed cause classes;
- owner and response deadline;
- allowed immediate controls;
- authority for degradation, stop, or rollback;
- links to runbook and redacted evidence;
- escalation path;
- clear resolution condition.
Page on urgent consequential symptoms or control failure. Route slower investigation for weak drift indicators, cost trend, or emerging qualitative categories. Do not page because a dashboard has data.
Thresholds need baseline and noise understanding. A zero-tolerance critical invariant can alert on one confirmed case. A rate metric needs enough volume and a defined denominator. Low-volume segments may require case-based review rather than unstable percentages.
Alert payloads can leak data. Keep them minimal. Link to a controlled diagnostic view rather than copy raw content into chat, email, and ticket systems.
Runbook: diagnose without default content access
- Confirm the user-visible symptom and time window.
- Check instrumentation health and missing-event rate.
- Compare behavior states, not only HTTP errors.
- Split by predeclared segments and relevant intersections.
- Correlate component, model, data, index, schema, and policy versions.
- Inspect evidence coverage, freshness, permission, and failure layer codes.
- Check latency, saturation, queue, retry, circuit, and cost state.
- Reproduce with frozen synthetic or evaluation cases.
- Use approved sampled content inspection only if the unresolved question requires it.
- Contain, correct, replay, and record residual uncertainty.
This sequence is not a universal incident process. It demonstrates that rich diagnosis can begin from structured states and IDs.
Design the event before implementing the collector
Consider a redacted Patchwork behavior event:
{
  "traceId": "PF09-T2",
  "timestamp": "2026-08-15T10:01:00Z",
  "taskCode": "discover",
  "segmentCode": "image-mobile",
  "behaviorState": "abstain",
  "failureLayer": "context",
  "evidenceIds": ["PF09-E2"],
  "componentVersions": {"ranker": "0.1", "policy": "0.3"},
  "latencyMs": 740,
  "costUnits": 13,
  "effectState": "none",
  "policyFlags": []
}
This synthetic event can answer which segment failed, where containment occurred, which evidence and versions participated, whether any effect exists, and how resources behaved. It does not include the user’s image, query, identity, or generated response.
Review every field.
traceId supports correlation but can become a lookup key to other stores. Limit access and expiry. timestamp supports sequence and retention but can enable linkage. Reduce precision in aggregate views. taskCode should use a controlled vocabulary rather than raw route text. segmentCode must be justified and avoid sensitive free-form labels.
behaviorState and failureLayer come from versioned taxonomies. evidenceIds support replay only if investigators can access the underlying evidence under a separate authorized path. componentVersions should avoid secrets and high-cardinality build noise. latencyMs and costUnits need clear clocks and units. policyFlags should be enumerated, not arbitrary strings.
Schema validation protects shape. It does not establish necessity, privacy, truth, or correct instrumentation. A valid event can still attach the wrong segment or failure layer.
Establish trace boundaries across asynchronous work
One user action can start synchronous retrieval, deferred indexing, tool confirmation, and later reconciliation. Decide which operations share a trace and which require linked traces.
A single indefinitely long trace can retain identity and state beyond purpose. Completely unrelated traces can prevent effect reconciliation. Use explicit relationships such as parent request, confirmed operation, and recovery replay.
Propagate only the minimum context. A downstream service may need trace ID and operation code, not user identity or raw content. Do not copy the entire upstream event envelope by convenience.
Sampling complicates continuity. If the parent is sampled out but a critical child failure occurs, tail-based sampling may retain the failure trace. Define how this affects denominators and privacy. Never imply that a sampled trace view represents all requests without weighting and missingness evidence.
Async queues can break timestamp interpretation and retention. Record event time and processing time separately where delay matters. Ensure deletion applies to queue payloads and dead-letter stores, not only the final trace database.
Sampling is a decision policy
Sampling reduces volume and exposure, but it can hide rare failures. Use different approaches for different signals:
- aggregate counters for common low-sensitivity states;
- head sampling for broad performance distributions;
- tail sampling for declared failure and latency states;
- stratified sampling for critical segments;
- bounded manual samples for qualitative investigation;
- zero default sampling of raw content unless separately authorized.
Record inclusion probability or sampling rule so analysts can interpret results. A dashboard that compares a fully collected error count with a one-percent sampled success count needs clear normalization.
Sampling after raw content reaches the collector does not reduce collection exposure. Make the decision before or at the earliest boundary possible.
Adversaries can exploit tail sampling by generating many failure events and forcing retention. Apply abuse controls, caps, and separation while preserving evidence for security response.
Aggregation can protect and mislead
Aggregation reduces detail, but small cells and intersections can still identify people. Apply minimum cell sizes, suppression, coarser time buckets, and access limits appropriate to the data.
Do not let privacy aggregation erase critical segments. If a group is too small for a broad dashboard, use a controlled review channel or longer justified time window. Report the blind spot rather than merge the group into a reassuring average.
Aggregation also changes causal interpretation. A daily rate can hide a ten-minute version incident. A global metric can hide one region. Keep the rawest permitted structured event long enough for the declared diagnosis, then aggregate or delete according to policy.
Avoid reconstructing identity through repeated drill-down. Access controls should apply to combinations, exports, and query volume, not only individual fields.
Access is part of the signal design
Least privilege asks who needs which view for which decision. A service operator may need latency, circuits, and failure codes without evidence access. A behavior investigator may need evidence identifiers and taxonomy. A domain reviewer may need a bounded sample. Privacy or security staff may need audit records.
Define:
- role and purpose;
- fields and views allowed;
- environment and device requirements;
- approval and time bound;
- break-glass path;
- access logging and review;
- export and copy restrictions;
- revocation trigger;
- training and confidentiality expectation.
Break-glass access should be rare, logged, time-limited, and reviewed. It should not become the normal way to make a dashboard useful.
Dashboards can leak through screenshots, shared links, browser caches, and copied identifiers. Treat presentation as part of the data path.
Threat-model observability itself
Telemetry systems concentrate operational and user context. Threats include:
- raw content accidentally written by an exception;
- secrets or credentials in headers and tool arguments;
- high-cardinality identifiers exposing activity;
- prompt injection text interpreted by an investigator tool;
- forged events hiding or fabricating failure;
- missing events from an attacker disabling collection;
- unauthorized dashboard queries;
- export to less controlled storage;
- over-retention in backups or tickets;
- cross-tenant trace correlation;
- model-generated summaries that reveal sensitive details.
Validate event origin and schema. Treat all logged strings as inert data. Escape them in views. Restrict free-form fields. Monitor collector failure and event loss. Separate tenants and environments. Encrypt and rotate credentials. Include the telemetry pipeline in incident response.
An observability outage is not simply missing charts. It can remove the evidence required for safe operation. Define whether the product degrades, stops, or continues under reduced diagnostic confidence.
Diagnose the green-service scenario step by step
Patchwork’s service health shows latency below 950 milliseconds and no service-error flag for three synthetic traces. If the operator stops there, the system appears healthy.
The behavior panel shows one normal text response and two image-mobile nonresponse states. Segment success is therefore 100 percent for text-warm and zero for image-mobile in the tiny fixture. This is not a population estimate. It is enough to trigger a deterministic diagnostic path.
The failure-layer view assigns both image cases to context. Evidence IDs are empty or limited. Component versions are the same across healthy and failed traces, weakening but not eliminating a ranker-version hypothesis. Service latency is below budget, so slow infrastructure is not the immediate symptom.
The next action is replaying image-mobile evaluation cases with context coverage instrumentation. It is not opening raw user images. If replay reproduces the missing evidence state, investigate image decode, embedding, index, permission, and freshness boundaries. If replay passes, inspect instrumentation change and an approved sample.
The dashboard should display:
- green service status;
- red critical-segment behavior status;
- trace count and sample limitation;
- context failure layer;
- current evidence and policy versions;
- next runbook action and owner.
This disagreement is a feature. A single blended health score would hide it.
Distinguish missing telemetry from good behavior
An event rate can fall because failures decreased or because the collector broke. Track instrumentation health:
- expected versus observed event count;
- schema rejection rate;
- queue delay and drop;
- version adoption;
- clock skew;
- sampling configuration;
- missing trace relationships;
- dashboard query freshness.
Use invariant ratios where appropriate, such as requests with a behavior-state event. A drop below expectation is an observability failure and may require degraded operation for high-consequence paths.
Do not automatically retry telemetry synchronously on the user path. Logging retries can amplify a collector incident and increase latency. Buffer within a bounded policy, shed low-priority events, preserve critical control records, and expose loss.
Separate alert evidence from causal claims
An alert can say: “Image-mobile abstention exceeded the declared threshold after policy v0.3 adoption.” It should not say: “Policy v0.3 caused image-mobile failure” unless a controlled analysis supports causation.
Record competing hypotheses:
- policy version changed behavior;
- image pipeline or index changed;
- segment tagging changed;
- traffic composition changed;
- instrumentation dropped successful events;
- dependency conditions changed;
- random variation dominates low volume.
Choose the next discriminating test. Replay across versions, compare paired traces, inspect instrumentation, or run a bounded canary under authority. Monitoring should create a decision path, not a confident story.
Turn feedback into governed evaluation evidence
When a user reports “this part does not fit,” intake should capture a controlled category, behavior and evidence version, permission to use the report, and a route. Avoid copying the entire conversation into multiple systems.
An adjudicator checks whether the report demonstrates an existing taxonomy case, a new error, a data issue, misunderstanding, or unresolved ambiguity. If it becomes an evaluation case, document provenance, transformations, split placement, access, and limitations. Keep the feedback artifact separate from release cases until contamination is addressed.
Selected reports can reveal categories that aggregate metrics miss. They cannot provide prevalence without a suitable sampling design. Ten complaints after a prominent feedback prompt may represent a smaller affected population than two reports from a hidden prompt. Volume alone is not comparable.
Close the loop with users only under product and privacy policy. Do not promise individual follow-up through an observability pipeline that lacks authority or staffing.
Retention should follow purpose transitions
Different stages may need different forms:
- short-lived detailed redacted traces for incident diagnosis;
- longer aggregated counts for trend detection;
- versioned synthetic fixtures for regression;
- separately governed adjudicated cases for evaluation;
- access audit records under a distinct security purpose.
Do not retain detailed traces merely because aggregate trends are useful. Transform or delete when the detailed purpose ends. Document whether deletion of the original also removes derived exports or whether a separately authorized aggregate remains.
The visual’s 30 DAYS label and the companion’s 14, 21, 30, and 45-day examples demonstrate multiple retention fields. They are fictional. A real policy must resolve applicable law, contracts, product need, data-subject expectations, security risk, backup handling, and deletion feasibility.
Retention changes require review. Extending a period is a new risk decision, not a dashboard configuration tweak.
Build deletion failure handling
Deletion jobs can fail partially. Define:
- idempotent deletion requests;
- store-by-store status;
- retry deadline and backoff;
- circuit and alert behavior;
- quarantine of records that cannot be deleted normally;
- authority for exceptional preservation;
- proof that identifiers no longer resolve;
- reconciliation across replicas and indexes.
Do not put the sensitive record itself in a deletion error log. Use opaque identifiers and store codes. Limit who can map them.
Test clock boundaries, daylight or timezone handling where wall dates matter, records without timestamps, malformed entries, and newly added stores. A deletion inventory that is not updated with architecture changes becomes false assurance.
Operational review packet
Before enabling a signal set, assemble:
Decision map. Signal to purpose, owner, threshold, action, authority, and blind spot.
Data map. Field to source, transformation, sensitivity, allowed use, access, retention, deletion, and export.
Schema and versions. Controlled vocabularies, compatibility, event producer, collector, and dashboard definitions.
Coverage. Which behavior, segments, context, tools, services, and effects are observed, plus explicit gaps.
Privacy and security review. Data minimization, threat model, applicable authority, residual risk, and prohibited collection.
Runbook. Symptom-first diagnosis, instrumentation checks, containment, bounded inspection, recovery, and escalation.
Test evidence. Synthetic redaction, segment diagnosis, sampling, access, deletion, and collector-failure cases.
Expiry. When versions, purposes, thresholds, and retention must be reviewed.
The packet does not authorize operation by itself. It makes claims and responsibilities inspectable.
Common observability disputes
“We need raw prompts to debug.” Name the unresolved question. Often behavior state, failure layer, evidence IDs, and version replay are sufficient. If not, define a bounded approved sample instead of default collection.
“The data is anonymous.” Opaque identifiers, timestamps, segments, and embeddings can still enable linkage or inference. State the transformation and residual risk rather than use anonymity as a blanket claim.
“Users consented to the product.” Product use does not automatically authorize every diagnostic purpose, retention period, or transfer. Resolve actual authority.
“Feedback proves satisfaction.” Feedback is selected, contextual, and interface-dependent. Keep it separate from representative outcome evidence.
“Drift caused the incident.” Drift is observed change. Test its relationship to behavior and alternative causes.
“No alerts means healthy.” It may mean thresholds did not fire, instrumentation failed, or unobserved behavior changed.
“Storage is cheap, so retain everything.” Financial storage cost does not measure privacy, security, legal, or operational burden.
“We can decide retention later.” Collection without a deletion plan creates immediate unresolved lifecycle risk.
Practice a privacy-conscious investigation
Imagine the dashboard raises a critical behavior alert for image-mobile after a new index version. The on-call operator begins with the redacted view.
First, verify instrumentation. Request count matches behavior-state count, collector delay is normal, and the segment code version did not change. This reduces the chance of a missing-event artifact.
Second, compare behavior by index version. The new version has more context failures in the synthetic replay and in authorized aggregate production signals. Association is strong enough to prioritize, not enough to claim cause.
Third, inspect evidence identifiers and source-state codes. Failed traces point to one image partition with low coverage. No raw image is needed. The retrieval owner reproduces the condition using frozen synthetic images and confirms that an index-build step omitted a feature family.
Fourth, contain. The release authority rolls the image path back to the prior index. Patchwork keeps text discovery available and abstains rather than use an ungrounded image fallback where rollback cannot apply immediately.
Fifth, verify. Replay passes on the corrected index, critical behavior returns inside threshold, and the team watches a bounded window. The incident packet keeps versions, counts, failure layer, correction, and residual uncertainty.
Only if identifier and replay evidence had failed would the team consider an approved content sample. That workflow would specify the unresolved question, smallest sample, reviewer, access window, transformations, deletion, and prohibition on unrelated reuse.
The investigation demonstrates a principle: minimization can improve diagnosis by forcing structured state and version discipline. Raw content is sometimes necessary, but it should be an escalation with evidence, not the first reflex.
Make dashboard language epistemically honest
Panel titles and annotations influence decisions. Use language that matches evidence.
Prefer:
Observed abstention rate in sampled image-mobile traces;Context failure code increased after version V; cause under investigation;Service p95 within budget; product segment below behavior threshold;Selected feedback reports, not population satisfaction;No observed critical errors in N covered cases.
Avoid:
Users are satisfiedfrom clicks;Model drift caused failuresfrom a distribution alert;Safefrom zero logged events;All userswhen telemetry is sampled;Anonymouswithout a defined transformation and threat analysis;Compliantfrom a retention configuration.
Include last-updated time, query window, sample or coverage, version, and missingness. A green color without these qualifiers can create false certainty.
Annotations should record deployments, instrumentation changes, incidents, and policy changes. They support interpretation but can themselves carry sensitive incident detail, so use controlled references.
Handle derived diagnostics and model summaries
Teams may use a learned system to cluster failures or summarize incident traces. That derived output is another component, not objective truth.
Define allowed inputs. Prefer redacted structured fields. Prevent the summarizer from receiving raw content unless separately authorized. Record its version, prompt or policy, output schema, limitations, and access.
Validate summaries against source events. A cluster label can merge different causes or invent certainty. Keep event counts and links to authorized evidence. Do not allow a generated incident narrative to trigger external effects or personnel judgments without review.
Derived artifacts inherit or increase sensitivity. A summary can reveal a pattern not obvious in individual events. Apply access, retention, deletion, and export policy. If source traces expire, decide whether the derived summary remains justified under a separate purpose or must also be removed.
Use deterministic rules for critical invariants. A model can assist exploratory categorization, but zero-tolerance permission violations should not depend only on an uncalibrated semantic classifier.
Respect user-facing transparency and control
Observability happens behind the interface, but users may need understandable notice and control. Explain relevant collection purposes at the appropriate level without exposing security-sensitive implementation. Make correction and feedback pathways accessible. Do not dark-pattern people into providing diagnostic content.
If a user deletes content or an account, connect that action to the applicable telemetry lifecycle and explain limitations under the actual policy. Avoid promises the architecture cannot execute.
When degraded behavior occurs, show what is unavailable and how to recover. This helps users distinguish a system state from their own error. It can also reduce repeated requests and support tickets.
Feedback requests should be optional and specific. “Was this compatible with your stated product revision?” produces more decision-bearing evidence than a generic satisfaction score, but it still requires interpretation and appropriate handling.
User control is not complete authority over every operational record, and operational need is not unlimited collection authority. Resolve the balance through product, privacy, security, and legal decision owners.
Define observability stop conditions
More instrumentation should not continue automatically when controls fail. Stop or reduce collection when:
- raw content appears in a prohibited field;
- schema or redaction failure exceeds threshold;
- tenant separation is uncertain;
- access logging is unavailable for sensitive views;
- deletion fails beyond its bounded recovery window;
- a vendor changes processing or retention terms without review;
- the signal has no active owner or decision;
- collection purpose expires;
- an incident creates unacceptable exposure.
Product operation may also need to degrade when essential observability is lost. A high-consequence effect path may stop if audit and reconciliation evidence cannot be written. A low-consequence read-only path may continue with reduced diagnostics under a time-bound decision. Name this behavior in the contract.
Collection stop authority, product stop authority, and legal preservation authority can differ. Map them before an incident.
Validate the observability system itself
Create tests for:
- allowed and forbidden fields;
- nested raw-content leakage;
- exception and dependency message sanitization;
- tenant and environment separation;
- stable taxonomy and schema versions;
- trace correlation across permitted boundaries;
- sampler inclusion and denominator reporting;
- collector loss and backpressure;
- dashboard query correctness;
- alert threshold and routing;
- access grant and revocation;
- break-glass logging;
- expiry and deletion across stores;
- exports, tickets, and backups;
- replay without raw content;
- green service with failing behavior.
Inject failures just as Chapter 13 did. Disable a collector, reject a schema, delay a queue, expire a trace, revoke an access role, and introduce a prohibited field. Confirm bounded behavior and evidence.
An observability test that only checks whether an event arrives misses semantic correctness and privacy. Assert that the event represents the right state and that forbidden data does not arrive.
Evidence limits for operational claims
The synthetic dashboard supports one narrow statement: the implementation can preserve separate service and behavior views and identify a constructed critical segment. It does not support a claim that real users are protected, the segment definition is valid, or the fields are legally permissible.
Production claims need current field inventory, data-flow verification, access logs, deletion tests, missingness estimates, real behavior taxonomy calibration, and named authority. Causal claims need experiments or analyses designed for the alternatives. Population claims need sampling evidence.
Write blind spots beside each signal so operators do not rediscover them during incidents. Review blind spots after every material failure. A previously unknown category should update taxonomy, cases, runbook, and possibly collection purpose.
Observability is successful when it changes a bounded decision with less user exposure, not when it accumulates the most data.
Review that standard periodically. Remove fields whose decisions disappeared, narrow access that grew through convenience, replay deletion, and challenge every new dashboard dimension. The safest useful signal set is not frozen forever; it evolves with the product while preserving purpose, minimization, evidence, and accountable authority.
Preserve rejected collection proposals as negative decisions. They document why raw content, identity, or extended retention was unnecessary for a particular diagnostic question. When a new incident reopens the request, reviewers can compare the changed need instead of restarting from an assumption that more data is always justified.
Trust grows when restraint is visible and consistently enforced.
What the companion proves
Run:
node --test content/publications/applied-ai-engineering/companion/tests/chapter-15.test.mjsThe tests verify that:
- raw content collection defaults off;
- every signal names purpose, sensitivity, owner, decision, retention, threshold, and blind spot;
- trace redaction keeps evidence and version IDs while removing raw prompt, image, and identity fields;
- a diagnostic view finds a failing image-mobile segment while service health remains green;
- retention deletion reports count and retained identifiers;
- feedback remains selected evidence and routes critical reports to adjudication.
They do not establish legal compliance, adequate real retention, de-identification, production security, population representativeness, causal diagnosis, or release authority.
An observability design review
Ask:
- Which decision does each field support?
- Can a state code or evidence ID replace content?
- Is raw collection off by default?
- Can fields become identifying in combination?
- Are symptoms distinct from suspected causes?
- Can service remain green while behavior fails?
- Are segments stable, justified, and minimally encoded?
- Which versions support replay?
- Is effect state separate from response success?
- Are feedback channels interpreted as selected?
- Does every alert have an owner and allowed action?
- Are access, sampling, retention, and deletion executable?
- Do exports, tickets, and vendor stores obey the same lifecycle?
- What blind spot remains after collection?
If the only diagnostic strategy is “look at the prompt,” the signal design is unfinished.
Observe enough to protect, not enough to betray
Useful observability preserves distinctions. User outcome is not engagement. Product behavior is not uptime. Drift is not cause. Feedback is not population truth. A valid trace is not permission to retain content.
Begin with decisions, collect the minimum structured evidence, correlate by version and trace, expose disagreements, and test deletion. Escalate to bounded content inspection only when an approved investigation cannot answer its question another way.
Patchwork can now diagnose a failing critical segment while keeping raw images and text out of default traces. That is not proof of privacy or operational readiness. It is a design in which usefulness and user dignity are both engineering constraints.
Chapter 16 will use these signals to connect detected threats and harms to implemented controls and named authority.