Make the System Observable and Operable
Design promise-linked signals, actionable objectives and alerts, privacy-safe cohort views, support feedback, and evidence-first diagnostic paths.
An observable system helps an operator decide which evidence to inspect next. An operable system gives that operator the authority, runbook, configuration, recovery path, and ownership needed to act.
A dashboard can exist without either. [CLM-116]
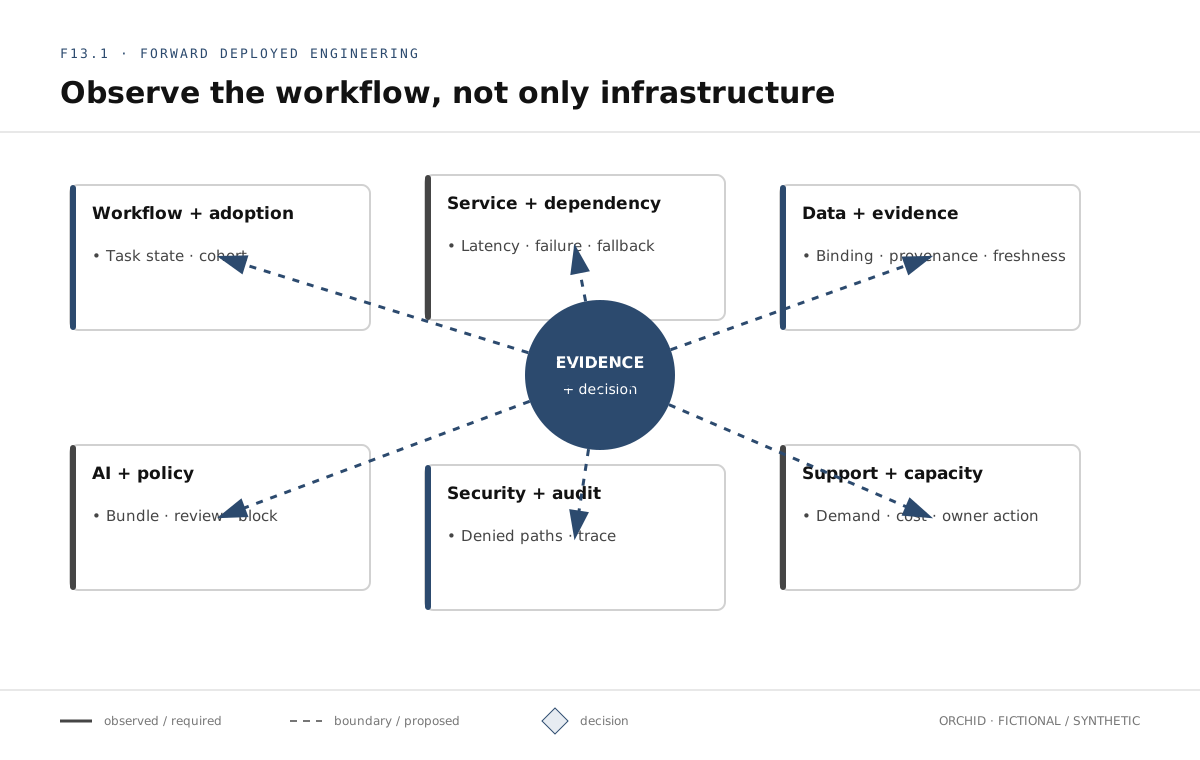
For Orchid Assist, “healthy” must be decomposed:
- Is the service reachable and within latency/capacity limits?
- Can users complete the ticket-to-review workflow?
- Is equipment/evidence data correct, current, and properly bound?
- Are model suggestions supported and policy controls working?
- Are qualified approvals and audit events occurring correctly?
- Are users adopting the path or escaping to manual work?
- Which sites/cohorts are degraded?
- Is support demand rising?
- Is the deployment affordable at the observed workload?
- Can owners diagnose and recover when a promise fails?
Availability alone cannot answer these questions. [CLM-108]
Start from promises and failure modes
For every production promise, record:
promise -> failure condition -> signal -> segment -> objective/threshold -> owner -> alert/first action -> runbook -> blind spot
Examples:
| Promise | Failure | Signal/segment | First action |
|---|---|---|---|
| reviewer receives truthful state | requests fail, stall, or misstate unknown completion | state/rate/latency by site and completion state | inspect trace and dependency completion |
| evidence belongs to equipment | wrong/stale/missing source | binding/freshness/missing/conflict by equipment family | inspect provenance/index/version |
| safety step needs qualified approval | bypass/denial/expired qualification | policy and authorization outcomes by tenant/region | inspect policy/identity bundle |
| bounded AI remains useful | abstention, unsupported output, prohibited action, latency/cost | eval/feedback/fallback/override by risk segment | compare system bundle and evidence quality |
| audit is useful and minimized | missing event or sensitive overcollection | event completeness/redaction/export/access | restrict exporter and inspect schema |
| users can adopt the service | abandonment/manual escape/support burden | completion/dropout/rework/support by role/site | observe workflow and support cases |
This map and the diagnostic tree are original synthesis tools. [CLM-105]
Turn one promise into an operating record
Take a qualified reviewer can reach a truthful evidence-backed state within the workflow window.
- Failure states: request unavailable, equipment ambiguous but shown as confirmed, evidence stale/missing, dependency completion unknown, policy/authorization wrong, review latency too high, or fallback absent.
- Signals: completed/blocked/fallback/reconcile states; equipment confidence; evidence version/freshness; dependency finality; policy/authorization; review latency; support reason.
- Segments: site/connectivity, equipment family, qualified role, release/config/model/policy bundle, and clear/ambiguous/missing state.
- Decision: hold expansion if a critical segment has wrong binding or no truthful fallback; investigate latency only after state correctness is preserved.
- Owner: workflow owner for the promise and boundary owners for contributing service/data/model/identity state.
- Blind spot: offline completion may arrive late; freshness and coverage remain visible.
The record refuses a common shortcut: treating a successful HTTP request as a successful review. It also shows why one promise needs several signals but one accountable operational decision.
Maintain linked operating views
Service and dependency
Request volume, success/error, latency distribution, timeout, saturation, queue, connection pool, retry versus new demand, dependency state, deployment/config/version.
Workflow and adoption
Tickets entering/completing/blocked/fallback/reconcile, time in state, rework, abandonment, manual escape, qualified-review load, evidence inspection, cohort ramp.
Data and evidence
Missing/ambiguous equipment, freshness, source version, conflicts, reconciliation age, tenant/region denials, index lag, approved-evidence coverage. Data/product quality models can structure questions but do not choose Orchid’s thresholds. [CLM-114]
AI, policy, and review
Suggestion/abstention/fallback, unsupported/prohibited cases from sampling/evals, retrieval/evidence quality, policy blocks, approval/override/disagreement, model/prompt/index/policy bundle, latency/cost.
Production AI operation monitors the whole decision path, not model uptime alone. [CLM-110]
Security and audit
Authentication/authorization denials, elevation, cross-boundary attempt, secret/config scan, audit completeness/redaction/access/export, exception expiry, control failure.
Support, capacity, and cost
Demand by reason/cohort, resolution/escalation, recurring confusion, workload/capacity headroom, unit-cost proxies, budget fallback. Support is a product/operating signal, not cleanup. [CLM-111]
Use metrics, traces, and logs deliberately
- Metric: aggregated numerical behavior suited to trends/objectives/alerts.
- Trace: causal path across a request/workflow using correlation/span context.
- Log/event: discrete structured fact useful for state, audit, and diagnosis.
OpenTelemetry documents these as distinct signals; APIs and vendor support remain version-sensitive. [CLM-107]
Do not force one signal to do every job. A metric can reveal a cohort change, a trace can locate a boundary, and a structured event can explain a policy reason. Correlate by safe identifiers and release/config/policy versions.
The companion’s local JSON metric/trace is inspectable and provider-neutral. It is not a production collector, exporter, storage, query, or alerting proof.
Define SLI/SLO/action records
An SLI/SLO record contains:
- user promise and affected cohort;
- indicator definition, numerator/denominator, exclusions;
- source, window, freshness, missing-data behavior;
- objective and owner/authority;
- consequence and tradeoff;
- alert condition/urgency/first action;
- response, exposure, release, or investment decision;
- known blind spot and review trigger.
Objectives should represent user-relevant behavior and change a decision. [CLM-106]
Do not copy universal targets. A 99.9 percent availability target can coexist with unusable evidence, slow low-connectivity sites, or unsafe critical-segment behavior. Thresholds belong to accountable owners using outcome/risk/cost evidence.
Specify an indicator so two operators calculate the same thing
Example bounded workflow indicator:
Numerator: eligible Orchid review intents in the internal pump-family cohort that reach
ready-for-reviewor an approved truthful fallback within 30 seconds. Denominator: all eligible intents during the window, including blocked, failed, abandoned, and unresolved completion states. Exclude only preidentified synthetic rehearsal intents. Segment by connectivity and equipment-state class. Source is versioned workflow events; coverage heartbeat must be current. If coverage is stale, status is unknown, not green.
The objective and 30-second value are fictional and require an owner. The mechanism is definitional: eligible population, good state, time boundary, exclusions, segmentation, source, missing behavior, and decision.
Pair the indicator with action. A critical wrong-binding event stops the affected path. Sustained latency may hold widening and activate fallback. A low-volume ambiguous segment may require targeted evidence rather than an availability page.
Preserve cohorts and tails
An aggregate can be green while one site is unusable. In the companion, nine of ten connected samples succeed while the low-connectivity cohort has zero success and 5-second average latency. The cohort view exposes what a combined rate would soften.
Segment by legitimate diagnostic factors:
- site/connectivity/region/tenant;
- role/qualification/access needs;
- workflow state and exception/fallback;
- equipment/evidence family/quality;
- release/config/policy/model bundle;
- latency/cost tail;
- new versus retry demand.
Avoid unbounded high-cardinality labels such as raw customer text or every identifier. Use correlation for targeted tracing, bounded dimensions for aggregation, and controlled investigation access.
Global averages can conceal consequential degradation. [CLM-109]
Read aggregate and cohort together
Suppose 90 of 100 intents complete. If all 10 failures belong to the only low-connectivity site, the conclusion is not mostly healthy; one intended cohort cannot use the workflow.
If that site has only two events and both fail, the evidence is serious but statistically thin. Hold unsupported expansion, inspect the mechanism, and gather representative evidence. Do not dilute it into the aggregate or pretend two events estimate a universal rate.
Always report count, denominator, window, coverage, and tail/segment with a rate. A percentage without exposure can hide rare critical failure and meaningless small samples.
Make alerts actionable
Every alert needs:
- promise/failure and exact condition;
- affected segment and evidence link;
- owner/on-call route and urgency;
- first discriminating action;
- runbook and access prerequisites;
- suppression/deduplication/escalation;
- recovery/clear condition;
- review of noise, misses, and cost.
An ownerless alert with no first action is noise, not control. [CLM-115]
Alert on user consequence or a strong leading indicator, not every metric movement. Page for urgent actionable conditions; use tickets/review queues for slower degradation. Test routing and runbook access.
Design one actionable alert
Orchid critical evidence-binding failure might contain:
- condition: any review-ready state where confirmed equipment and evidence equipment ID disagree;
- segment: tenant, region, equipment family, release/config/policy bundle; no raw ticket text;
- urgency: page workflow on-call and release owner immediately;
- first action: stop affected suggestion path, preserve identifiers/versions, verify whether external approval occurred;
- runbook: binding/reconciliation response with access prechecked;
- escalation: designated security/safety/customer authority by consequence;
- clear condition: affected state reconciled, control restored, and owner approves bounded re-entry;
- review: every event becomes verification/regression evidence.
Inject a synthetic mismatch. Confirm the route reaches a qualified owner, the link/query works, the first action is possible, and no sensitive content leaks into the notification.
Follow an evidence-first diagnostic tree
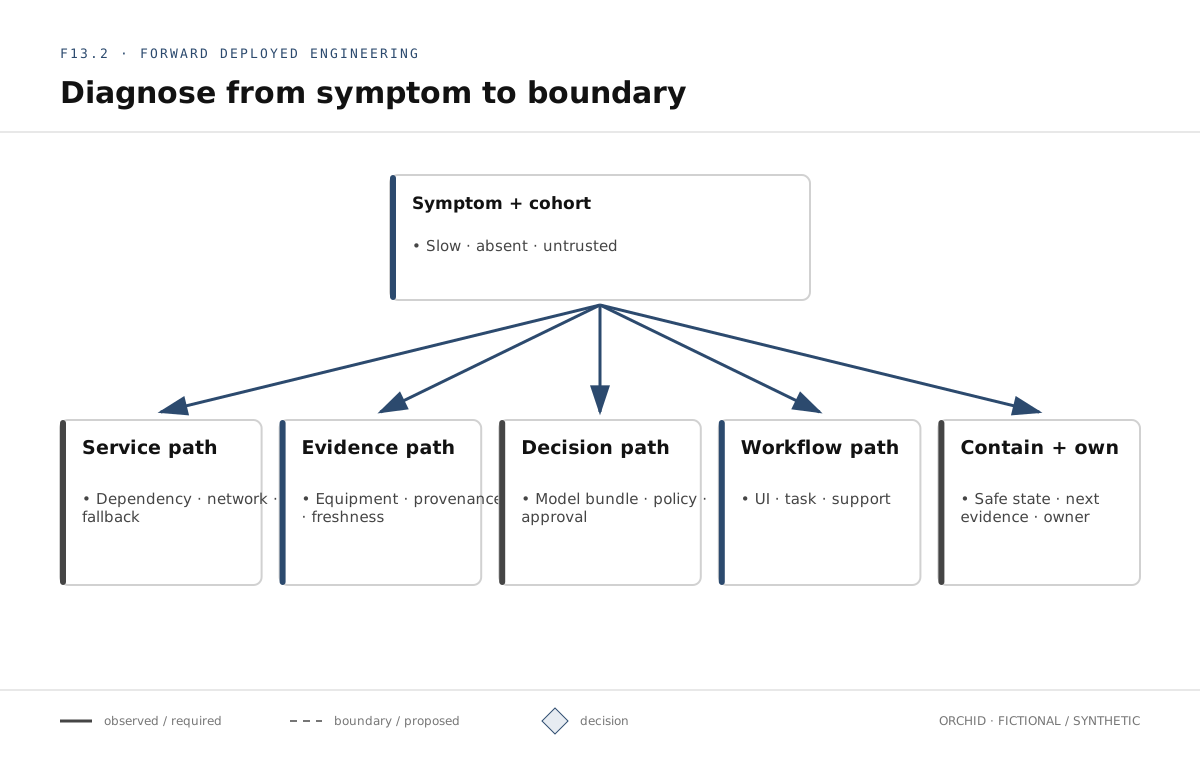
For “slow or untrusted recommendation”:
- Confirm scope, cohort, time, release/config/policy/model version.
- If service unhealthy, inspect correlated service/dependency trace and saturation.
- If one cohort degraded, compare connectivity, latency tail, payload size, retry/fallback, site dependency.
- If evidence untrusted, inspect equipment binding, provenance, freshness, index/cache, tenant/region.
- If policy blocked, inspect policy version, authorization, qualification, approval and exception.
- If the system path is healthy, inspect adoption, review UI, task evidence, support and outcome.
- Contain exposure, preserve evidence, assign owner, update tests/signals/runbook.
The companion returns the next discriminating evidence rather than a confident root cause.
Walk a diagnosis without guessing
Symptom: technicians at one site report slow and untrusted suggestions.
- Compare affected/unaffected sites and current release/config/model/policy versions.
- Aggregate service latency is normal; the site cohort shows a long tail and frequent fallback.
- Trace a representative approved/synthetic intent. Evidence waits after repeated inventory completion checks.
- Inspect intent state: requests are unknown completion and clients retry as new work.
- Contain by holding the site cohort and using truthful manual fallback; preserve and reconcile intent records.
- Verify evidence provenance. If it remains correct, do not mislabel the event an AI-quality failure.
- Assign retry/dependency correction, capacity test, cohort signal, and runbook update.
Each step narrows hypotheses. The tree avoids jumping from untrusted AI to prompt changes when the observed boundary is retry/finality under weak connectivity.
Bound telemetry by privacy, security, cost, and usefulness
Do not log raw ticket payloads, prompts, manuals, secrets, documents, or free text by default. Define:
- purpose and fields;
- classification and allowed users;
- tenant/region and export boundary;
- retention/deletion/legal hold owner;
- cardinality/volume/cost budget;
- redaction/sampling and missing-data consequence;
- integrity/time source;
- investigation and audit separation.
More data can create more exposure and noise. Telemetry must be minimized and cost/cardinality constrained. [CLM-112]
The companion rejects forbidden telemetry fields even when the sample is otherwise valid.
Treat missing telemetry as a state
No events can mean no traffic, broken instrumentation, blocked exporter, wrong query, clock skew, dropped sampling, or access failure. Define heartbeat/coverage/freshness signals and fail the dashboard visibly when evidence is stale or incomplete.
Instrumentation changes require review and tests like product code. A renamed label can silently empty an alert. Version schemas and queries; compare pre/post deployment.
Connect incidents to improvement
For a material event:
- detect and validate scope/consequence;
- contain/disable/isolate/fallback as authorized;
- preserve minimized evidence;
- communicate and escalate;
- recover and verify user-visible state;
- analyze technical/workflow/organizational contributors;
- update control, test, signal, runbook, support, ownership, and product pattern.
NIST SP 800-61r3 integrates incident response with cybersecurity risk management; organizations still define their own command/authority. [CLM-113]
The FDE can diagnose and coordinate within delegated scope but does not impersonate incident commander, legal/privacy/security authority, or customer spokesperson.
Turn quality evidence into operating signals
Do not run every expensive evaluation on every request. Layer the plan:
- online deterministic invariants for equipment/evidence binding, tenant/region, policy, permission, required approval, budgets, and audit shape;
- sampled qualified review for contextual usefulness and unsupported behavior;
- scheduled regression suites on frozen and rotating cases;
- targeted evaluation after model, prompt, index, policy, or tool change;
- governed support/feedback cases curated into datasets;
- workflow/adoption/outcome signals that reveal whether correct-looking suggestions help.
Record sampling and blind spots. Reviewing only completed requests hides abandonment, fallback, and blocked states. Voluntary feedback can exclude silent cohorts.
Connect data quality to consequence: equipment correction rate, evidence freshness, conflicting-source age, index lag, reconciliation age, semantic rejection by source version, cross-boundary denial, and manual escape. A freshness distribution without an acceptable age and owner is not actionable.
Operate support as part of the service
Classify support demand by workflow state and reason:
- access or qualification;
- equipment/evidence mismatch;
- latency/connectivity;
- fallback/reconciliation;
- confusing suggestion/evidence;
- inaccessible interface;
- training/process gap;
- dependency incident or defect;
- feature/config/cohort mismatch.
Track first useful response, resolution/escalation, repeat contact, unresolved age, and recurrence. Protect support content; extract minimized categories and approved cases. Feed recurring demand into product, documentation, tests, signals, rollout, and ownership.
Operate capacity and cost together
Build the capacity model from intent rate, concurrency, evidence size, quotas, connections, retrieval/model use, retries, fallback, reviewer capacity, telemetry, and support.
Watch headroom, saturation, queue age, rejection/defer behavior, expensive failure paths, cost per eligible/completed intent, model budget exhaustion, telemetry cardinality/storage/query cost, and reviewer/support load.
Do not optimize cost by removing required control/evidence. Do not add infrastructure when the constraint is stale data or qualification. When capacity is insufficient, rate-limit, visibly queue, restrict cohort, or fall back under owner rules. Silent latency creates abandonment and retries.
Write and test runbooks
A runbook contains:
- symptom/alert and affected promise;
- access, authority, prerequisites, and cautions;
- first query/evidence and interpretation;
- diagnostic branches;
- containment choices/consequences;
- escalation/communication owner;
- recovery verification/clear condition;
- evidence/privacy handling;
- last rehearsal and known gaps.
Test it with someone other than its author. Verify links, access, queries, feature controls, reconciliation, and recovery under the target failure. A document that assumes unavailable identity or control plane is not an operating path.
Rehearse under the failed dependency
Give an operator a synthetic alert while the normal identity path is unavailable. Observe whether the operator can authenticate through approved emergency access, find the cohort and versions, choose containment, preserve minimized evidence, communicate through the named owner, and verify recovery.
Record assistance, timing, stale links, missing access, ambiguous steps, unsafe commands, and gaps. Repair and rerun. The goal is not a fast theatrical drill; it is a path another qualified operator can execute under the failure conditions it claims to address.
Failure modes and repairs
Dashboard equals observability
Repair: connect promises to failures, segments, owners, next evidence, runbooks, authority, and recovery. [CLM-116]
Availability equals health
Repair: include workflow, data/evidence, AI/policy/review, security/audit, support, adoption, capacity, and cost. [CLM-108]
Global green hides a cohort
Repair: preserve legitimate segments, counts, tails, coverage, and consequence. [CLM-109]
Every metric pages
Repair: page urgent actionable conditions; route slow degradation to review. Bind owner, evidence, first action, and clear condition. [CLM-115]
Telemetry becomes sensitive exhaust
Repair: purpose-bound schemas, allowlists, safe identifiers, retention/access/export rules, and cardinality/cost budgets. [CLM-112]
Missing data looks healthy
Repair: heartbeat, freshness, coverage, versioned queries, and explicit unknown state.
Runbook exists but cannot run
Repair: exercise access, queries, controls, communications, and recovery under the representative failed dependency.
Keep a blind-spot register
For every missing, delayed, or sampled signal record the promise/failure, affected cohort, alternative detection, consequence, release/exposure restriction, owner, target, and trigger for urgency.
“We cannot measure it yet” is acceptable only when it changes the decision. A hidden blind spot is not.
Write a blind-spot record
Example:
Offline technicians can complete manual fallback without emitting an event until reconnect. Promise affected: truthful completion and support visibility for low-connectivity sites. Consequence: the dashboard can undercount fallback burden and overstate timely completion. Alternative evidence: delayed sync plus support sample and scheduled task observation. Release restriction: do not widen to additional offline sites. Owner: workflow operations. Trigger: implement signed queued state with freshness/coverage signal before the next cohort review.
The record changes exposure and evidence collection. It is not a backlog note hidden beneath a green dashboard.
Work capacity, cost, and support as one operating decision
Suppose the Orchid evidence path has 40 concurrent review intents, inventory allows 20 concurrent calls, the model budget allows 15 suggestions per minute, and three low-connectivity sites retry after eight seconds. Qualified reviewers can process 12 critical cases per hour.
An incomplete capacity plan scales only the application service. A complete plan asks:
- can intent identity/reconciliation prevent retry demand from becoming new external work?
- where does bounded queuing preserve truthful user state?
- when should the system abstain or use manual fallback as model budget is exhausted?
- can reviewer capacity preserve the qualified-control latency?
- which evidence, telemetry, and support work grows with each cohort?
- what cost is per eligible, completed, fallback, and failed intent?
- which cohort/feature stops first under saturation?
Precommit behavior. New suggestion work may queue visibly or fall back, while safety-relevant review cannot be bypassed for throughput. Capacity limits should stop before external mutation where possible. Cost optimization cannot remove required evidence or authorization.
Connect support cases to the same state model
Do not classify all tickets as user issue or AI quality. Use equipment state, evidence state, dependency finality, policy/authorization, connectivity, review, fallback, and release bundle.
For each support reason, link count/cohort, first useful response, resolution, recurrence, defect or knowledge classification, owner, and product/test/signal/runbook update. A repeated question about evidence provenance may indicate interface design debt. A spike in unknown-completion tickets may reveal reconciliation or connectivity failure. The same state language lets support evidence join engineering diagnosis without copying sensitive content.
Conduct the operability exercise
Give a second operator three symptoms: a global-green but failed low-connectivity cohort, a critical evidence-binding alert, and a dashboard with stale coverage. The operator must select next evidence, use approved queries/access, contain the affected path, communicate through authority, and choose a runbook/recovery action.
Then inject retry demand plus model/reviewer budget pressure. Require an explicit queue/restrict/fallback decision and record user state, guardrails, support, and cost. Pass when the operator acts without raw sensitive payloads or hidden FDE knowledge and every missing signal changes the release or investigation decision.
Complete OA-08 operating layer
The artifact now includes:
- signal catalog across eight linked views;
- SLI/SLO/action records with contextual thresholds pending owner approval;
- cohort/tail query designs and explicit blind spots;
- alert owner/urgency/first action/runbook;
- diagnostic tree and containment/escalation;
- telemetry privacy/retention/cardinality/cost rules;
- support and feedback loop;
- local companion evidence with four new tests.
The 32 cumulative tests prove signal-record completeness, cohort visibility, sensitive-field rejection, and diagnostic routing in the synthetic bundle. They do not prove a production telemetry pipeline or threshold.
The Chapter 13 gate
Before release/recovery design completes, every critical promise must have:
- a signal or explicit blind spot/consequence;
- user/workflow/data/AI/security/support/capacity/cost coverage;
- segment/tail visibility;
- release/config/policy/model correlation;
- owner, threshold authority, urgency, and first action;
- runbook/access/escalation;
- privacy/retention/cardinality/cost boundary;
- missing/stale telemetry behavior;
- incident-to-improvement loop;
- passing companion signal tests.
The gate passes when an operator can move from symptom to the next discriminating evidence and authorized action without exposing sensitive content or trusting a global green average.
Chapter 14, Engineer Release and Recovery, will use these signals to gate change and demonstrate rollback, roll-forward, isolation, restoration, and stop decisions across representative state.